Category: Monitor

Integrating Splunk ITSI and Observability Cloud for Unified Insights

The Splunk Observability Cloud suite (O11y) delivers powerful real-time infrastructure and application monitoring capabilities, while Splunk IT Service Intelligence (ITSI) enables holistic and fully customisable service modelling and impact analysis. When these two technologies are integrated, they effortlessly bridge the gap between tracking infrastructure performance and the overall well-being of your business service.

Making Splunk Core Aware of O11y

A fundamental aspect of integrating ITSI and O11y is making observability metrics available to Splunk Core, and in turn, to Splunk ITSI and IT Essentials Work. For this you’ll need…

This is a Splunk built add-on available on Splunkbase: Splunk Infrastructure Monitoring Add-on.
While the name points to the SIM portion of the O11y suite, the Splunk Infrastructure Monitoring Add-on facilitates access to all O11y metrics, including APM, RUM and Synthetic Monitoring metrics.
NOTE: It is only O11y metric data that can be made available to Splunk Core – not the traces and spans from which these metric results and metadata originate.

SIM Add-on Integration Options

The add-on offers two integration options:
1. Enable Splunk Core to Query O11y Metric Stores
The Splunk Infrastructure Monitoring Add-on introduces a new SPL command called “sim” which allows you to specify a SignalFlow program for querying observability metrics in an SPL search. The SignalFlow program will be run on the remote O11y instance, and the returned metrics can then be processed in the remainder of the SPL search. 

2. Ingesting O11y Metrics into Splunk Indexes
The add-on also contains modular inputs which can be used to index O11y metrics in Splunk Core indexes. You are able to configure these modular inputs by specifying a SignalFlow program which will be run periodically to query the desired O11y metric summaries and index the results in Splunk Core.

NOTE: Ensure that the “stash” source type is always used for the data collected by these modular inputs (as in their default state) so that the collected metrics will not count toward Splunk licence charges.

Where to Install the SIM Add-on

Depending on which integration options are required, the add-on will need to be installed in at least one of these Splunk Core nodes:

Search Heads:
Required on any Search Heads where the “sim” command will be used in SPL searches to query O11y metrics.  In particular, this add-on will be required on Splunk ITSI instances utilising the “sim” command in KPI searches.

Indexers:
Required on any Indexer node/cluster where target metric store indexes are created for ingesting O11y metrics via the SIM add-on modular inputs. The add-on creates an index called “sim_metrics“ which should be used as the default target for O11y metrics as it will not count toward Splunk licence charges (and remember to specify “stash” sourcetype in the modular inputs as noted above).

Forwarders:
Required on any Heavy Forwarder node which will be running the SIM add-on modular inputs to query O11y metrics.

Which Integration Option Is Best?

While it is not possible to give a “one size fits all” answer, consider the following:

The “sim” command is lightning-fast
This is because the metric store of O11y is lightning-fast. By design, the O11y platform is capable of storing and retrieving massive volumes of highly granular data in real time. So performance is rarely a consideration when writing SPL searches using the “sim” command.

The Modular Inputs Duplicate Predetermined Metric Summaries
With the modular inputs of the add-on, you are able to decide ahead of time what O11y metric data you’d like to summarise and index in Splunk Core and at what intervals. While this will only be a subset of the original data that is being indexed, it is still duplication which might not be necessary in a given use case. More to the point, searching the summarised data indexed in Splunk Core lacks the flexibility of using “sim” searches to query metrics directly from O11y, which can be changed on the fly without ever needing to update any modular inputs or re-ingest any data.

Querying O11y directly with the “sim” command would often be the more desirable option.  However, in some scenarios it may be necessary to index O11y metrics in Splunk Core, e.g if security policies prevent certain Splunk Core users from getting direct access to O11y.
TIP: Use the O11y plot editor to create and test SignalFlow programs which can then be copied into “sim” commands in Splunk Core searches and ITSI KPIs.

Enriching ITSI with O11y Knowledge

The sky’s the limit when modelling systems in ITSI, and for large or complex service models you’ll want to leverage templates and pre-built components instead of re-inventing the wheel.
Content Packs are the mechanism in ITSI for bundling pre-built components, and for O11y content in particular there is…

The Content Pack bundles a set of valuable ITSI knowledge objects which can be leveraged for managing and visualising O11y data, including:
> Services and KPIs
> Service Templates and KPI Base Searches
> Glass Tables and a Service Analyser
> Entity Types and Entity Import Jobs

As with those of any ITSI content pack, many of the above components may not be directly usable for a given use case. They may instead serve as examples or initial templates to the custom content you will be creating.
At the very least, the below entity import jobs from the content pack are invaluable for effortlessly bringing in all O11y-discovered objects to the ITSI entity database:
> ITSI Import Objects – Get_OS_Hosts
> ITSI Import Objects – Get_RUM_*
> ITSI Import Objects – Get_SIM_AWS_*
> ITSI Import Objects – Get_SIM_Azure_*
> ITSI Import Objects – Get_SIM_GCP_*
> ITSI Import Objects – SSM_get_entities_*
> ITSI Import Objects – Splunk-APM Application Entity Search

Whatever the situation, it is in your best interest to install the Content Pack for Splunk Observability Cloud in ITSI when integrating with the O11y suite.

Installing the O11y Content Pack

The latest O11y Content Pack requires the following two add-ons to be installed in the Splunk Core environment first:
> Splunk Infrastructure Monitoring Add-on – The Splunk-built add-on described earlier in this document
> Splunk Synthetic Monitoring Add-on – A SplunkWorks-built add-on (not formally released by Splunk)

Also, if the Content Pack for Splunk Infrastructure monitoring was previously installed in ITSI, then there are additional migration steps to perform before installing the O11y content pack:
> Migrate from the Content Pack for Splunk Infrastructure Monitoring to the Content Pack for Splunk Observability Cloud topic

After the above items are addressed, the method for installing the Content Pack in ITSI is the same as with any other content pack, i.e. via Configuration > Data Integrations > Content Library.
TIP: When installing the content pack, consider using the option of adding a prefix to the names of imported content such as services, service templates and KPI base searches. That way they can be easily identified as examples which can be copied from. This is not so important for items like the entity import jobs (and you may then need to separate imports for differently named objects).

Unified Alerting with O11y and ITSI

In an environment armed with ITSI, an ideal strategy is to consolidate alert management  with ITSI as the central point for processing alerts originating from any Splunk sources such as O11y, as well as from external systems. ITSI’s advanced analytics can be leveraged to implement intelligent alert logic and the alerts actions can interface to Splunk On-Call for escalation management.

This Content Pack is required in ITSI for integrating O11y and ITSI alerting. It comes with correlation searches and aggregation policies that are utilised in the integration procedure (as noted in the High Level Implementation Plan further below).
Installing this Content Pack requires additional version-dependent actions as well as an update to the “Itsi_kpi_attributes” lookup. Please follow the below installation instructions:
Installing and Configuring the Content Pack for ITSI Monitoring and Alerting

Universal Alerting

Splunk have defined the Universal Alerting Field Normalisation Standard in ITSI for which there are pre-built correlation searches provided in the Monitoring and Alerting Content Pack. Normalising alerts to adhere to this schema ensures that alerts from any source can be processed in a common fashion using the pre-built content.
The schema details many fields, many of which are optional, and the following 4 are mandatory for any alert to comply:
> src: the target of the alert, e.g. host, device, service etc.
> signature: a string which uniquely identifies the type of alert
> vendor_severity: the original vendor-specific severity/health/status string
> severity_id: normalised severity

High Level Implementation Plan

  1. Configure O11y to send alerts to Splunk Enterprise or Cloud Platform:
    This requires creating an alert index in Splunk Core (labelled “Alert Index” in the above diagram), and a HEC endpoint. Then in O11y you can configure a new “Webhook” integration to send alerts to the HEC endpoint.
  2. Normalise O11y alerts to conform to the ITSI Universal Alerting schema
  3. Configure “Universal Correlation Search – o11y” to create notable events:
    This correlation search is shipped with the ITSI Monitoring and Alerting content pack
  4. Configure the “Episodes by Application/SRC o11y” notable event aggregation policy (NEAP):
    Also shipped with the ITSI Monitoring and Alerting content pack
  5. Configure ITSI correlation searches for monitoring aggregated episodes:
    The below 2 searches, also from the content pack:
    “Episode Monitoring – Set Episode to Highest Alarm Severity o11y”
    “Episode Monitoring – Trigger OnCall Incident”
  6. Integrate Splunk On-Call with ITSI:
    This requires installation of the Splunk On-Call (VictorOps) addon in Splunk core, and configuring it with the details of an O11y Splunk On-Call account
  7. Configure action rules in the ITSI NEAP from step 4 for Splunk On-Call Integration
  8. Configure Splunk On-Call with appropriate escalation policies

Full implementation details are documented on the Splunk Lantern site: Managing the lifecycle of an alert from detection to remediation

Next Steps

Now you have the playbook to integrate the Splunk Observability Cloud suite with Splunk ITSI. 
JDS excels in delivering tailored solutions for our customers where we integrate their O11y suite with Splunk ITSI, optimising alert management and reducing Mean Time to Resolution (MTTR).
Reach out if you would like help or advice in improving your observability and troubleshooting efficiency with Splunk Observability Cloud and Splunk ITSI.


Read a recent JDS Customer Success Story here.

One Platform. Full Stack. In Context

JDS has a proud history of working with industry-leading tools and ensuring they provide value for your business. We are excited to share that one of our major partners, Cisco, has announced their much-anticipated Full-Stack Observability (FSO) Platform at CiscoLive Las Vegas this month. We have been looking forward to the launch of the FSO platform which will help us unlock much greater value in Observability data. This will benefit our clients by allowing them to bring in a wider variety of data across the app and infrastructure stack, enriched with business context and activity data so you can ensure your tech is optimised for maximum business performance.
https://www.cisco.com/c/en_ca/solutions/full-stack-observability.html?socialshare=lightbox-fso-video

Most of our clients are involved in some level of digital transformation – be it moving to cloud-native or SaaS stacks, simplifying customer experiences with digital apps, or streamlining business processes with smart tech. This has typically meant a lot more moving parts and every time something isn’t right, a new needle-in-the-haystack challenge is presented. Being able to observe a customer’s journey and experience, including all of the technical and business elements involved, pinpoint problems or identify high-value optimisations, is critical for operational success. 

Businesses need the ability to get fast answers to questions like “where is slowness occurring”, “how can we optimise resource usage” or “where can we improve conversion.” Cisco FSO Platform has a ubiquitous and context-rich data platform, with flexible query tools and packaged solutions, to ensure IT is working at its best.

An Overview of the Cisco FSO Platform

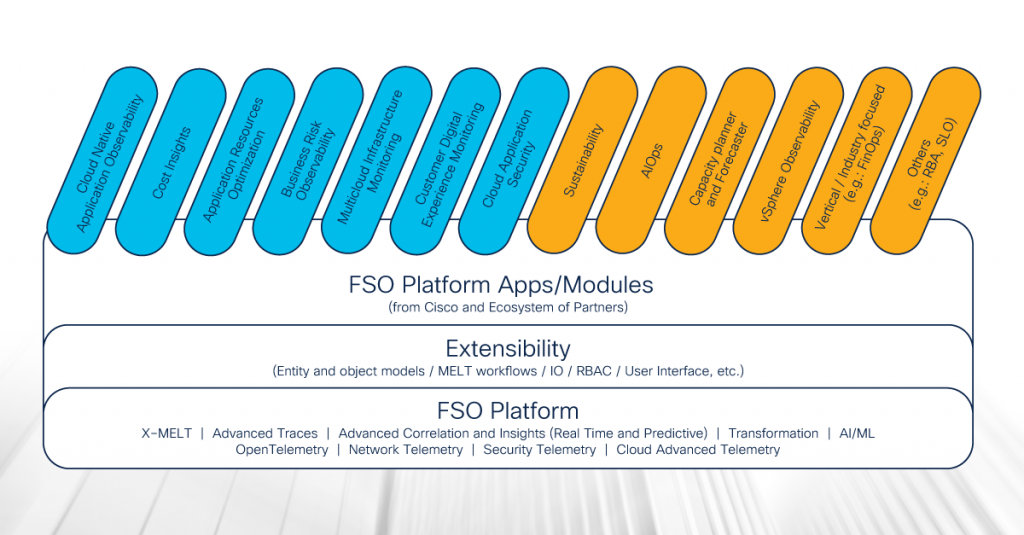
The Cisco FSO Platform was designed from the ground up to provide end-to-end visibility across complex, hybrid and multi-cloud environments. It delivers an extensible, entity-based data model that provides the flexibility to ingest any observability data with business context. By leveraging OpenTelemetry and harnessing the power of Metrics, Events, Logs, and Traces (MELT) to seamlessly collect and analyse data generated by any source, the FSO Platform is a versatile and comprehensive solution to capture observability data across an enterprise.

Right out of the gate there are features for application visibility, security insights, resource and cost optimisation, plus partner-led tools for financial visibility and capacity planning. 


Cloud Native Application Observability

One of the standout features of the Cisco FSO Platform is its Cloud Native Application Observability capability. This feature provides deep visibility into cloud-native environments, allowing organisations to monitor and troubleshoot their applications with ease. By providing insights into digital experiences, ensuring performance alignment with end-user expectations, prioritising actions, and reducing risks, businesses can gain valuable insights into the performance and behaviour of their applications. This allows customers the ability to identify and resolve issues before they impact users.

The Verdict

The Cisco FSO Platform is an innovative solution that offers an impressive suite of features that enable businesses to enhance digital experiences, mitigate risks, and drive operational efficiency.  

The Platform represents a significant milestone in Cisco’s FSO strategy, and shows their commitment to providing a comprehensive observability solution for clients. While other observability platforms can ingest data at scale, they face challenges in understanding and building a view of services.  Cisco’s approach was to build a solution that utilises an entity model at its core, which can be tailored to overcome these limitations. This is crucial with the complexity of modern applications spanning cloud, on-premise, microservices, SaaS, and serverless technologies, yet still needing to understand your customers’ digital journey and experience as they interact with your business. 

We will be keeping a keen eye on developments and look forward to sharing our experiences as we work with our customers to rationalise their observability strategies, harnessing the unique capabilities of the FSO Platform.

Top 7 benefits of JDS Active Robot Monitoring

JDS has spent a lot of time this month showing how our bespoke synthetic monitoring solution, Active Robot Monitoring with Splunk, is benefitting a wide variety of businesses. ARM has been used to resolve website issues for a major superannuation company and is improving application performance for a large Australian bank. We’re also currently implementing an ARM solution for one of the biggest universities in Australia and a major medical company. Find out more about the benefits of JDS Active Robot Monitoring below.


Summary of ARM

ARM is a capability developed by JDS that enables synthetic performance monitoring for websites, mobile, cloud-based, on-premise, and SaaS apps. It provides IT staff and managers a global view of what’s happening in your environment, as it’s happening. You can then use the customisable results dashboard to easily consume performance data, and drill down to isolate issues by location or transaction layer.

Top 7 benefits of ARM

1. Get an overall picture of an application’s end-to-end performance

How long does it take for your page to load, or for a user to log in? Can they log in? You may be getting green lights from all of the back-end components individually, but not realise the login process is taking three times longer than normal. ARM gives you the full picture, helping you spot performance issues you may not notice in the back-end.

2. Small increase in data ingested

If you’re already using Splunk, the amount of data you ingest with ARM is minimal, meaning you are getting even more out of your enterprise investment at an extremely low cost.

3. Fast time to value

Many IT projects can take years to show a return on investment, but ARM is not one of them. Once implemented, IT and development teams see value fast as their ability to hone in on and resolve issues accelerates and the number of user issues decreases.

4. Performance and availability metrics based on users location

See how your website, system, or application performs in different locations to find out where issues may be occurring and how to fix them.

5. Proactively find and alert on issues before users do

Users discovering glitches or errors is damaging to a business’s reputation. The ARM robots are constantly on the look-out for problems in the system and will alert you when issues arise so you can resolve them before they negatively impact your customers.

6. Monitor performance 24/7, even while users are asleep

Humans sleep; robots don’t. ARM monitors your application 24/7 to ensure even your late-night customers have a stellar user experience.

7. Get unlimited transactions

Unlike other synthetic monitoring tools, which charge on a per-transaction basis (i.e. every user transaction you want to run invites a new charge), ARM allows you unlimited transactions, so you can measure whatever actions you think your users may take.


The Splunk Gardener

The Splunk wizards at JDS are a talented bunch, dedicated to finding solutions—including in unexpected places. So when Sydney-based consultant Michael Clayfield suffered the tragedy of some dead plants in his garden, he did what our team do best: ensure it works (or ‘lives’, in this case). Using Splunk’s flexible yet powerful capabilities, he implemented monitoring, automation, and custom reporting on his herb garden, to ensure that tragedy didn’t strike twice.

My herb garden consists of three roughly 30cm x 40cm pots, each containing a single plant—rosemary, basil, and chilli. The garden is located outside our upstairs window and receives mostly full sunlight. While that’s good for the plants, it makes it harder to keep them properly watered, particularly during the summer months. After losing my basil and chilli bush over Christmas break, I decided to automate the watering of my three pots, to minimise the chance of losing any more plants. So I went away and designed an auto-watering setup, using soil moisture sensors, relays, pumps, and an Arduino—an open-source electronic platform—to tie it all together.

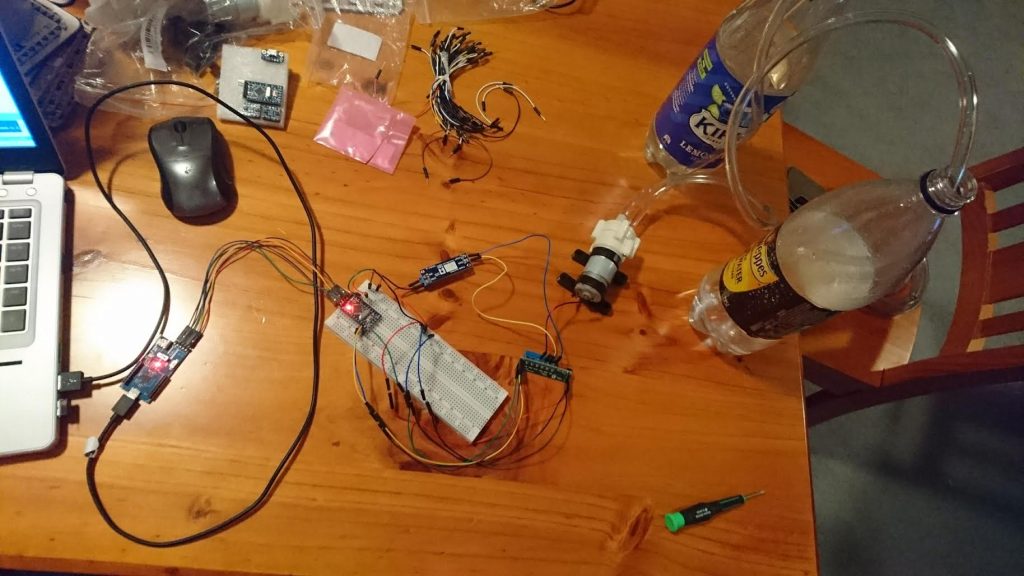
Testing the setup by transferring water from one bottle to another.

I placed soil moisture sensors in the basil and the chilli pots—given how hardy the rosemary was, I figured I could just hook it up to be watered whenever the basil in the pot next to it was watered. I connected the pumps to the relays, and rigged up some hosing to connect the pumps with their water source (a 10L container) and the pots. When the moisture level of a pot got below a certain level, the Arduino would turn the equivalent pump on and water it for a few seconds. This setup worked well—the plants were still alive—except that I had no visibility over what was going on. All I could see was that the water level in the tank was decreasing. It was essential that the tank always had water in it, otherwise I'd ruin my pumps by pumping air.

To address this problem, I added a float switch to the tank, as I was aiming to set it up so I could stop pumping air if I forgot to fill up the tank. Using a WiFi adapter, I connected the Arduino to my home WiFi. Now that the Arduino was connected to the internet, I figured I should send the data into Splunk. That way I'd be able to set up an alert notifying me when the tank’s water level was low. I'd also be able to track each plant’s moisture levels.

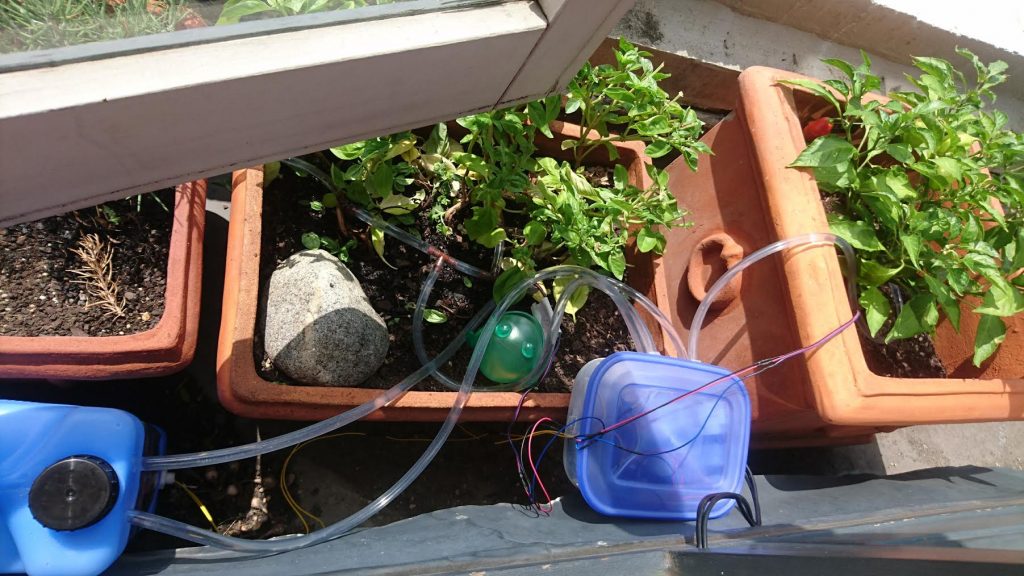
The setup deployed: the water tank is on the left; the yellow cables coming from the tank are for the float switch; and the plastic container houses the pumps and the Arduino, with the red/blue/black wires going to the sensors planted in the soil of the middle (basil) and right (chilli) pots. Power is supplied via the two black cables, which venture back inside the house to a phone charger.

Using the Arduino’s Wifi library, it’s easy to send data to a TCP port. This means that all I needed to do to start collecting data in Splunk was to set up a TCP data input. Pretty quickly I had sensor data from both my chilli and basil plants, along with the tank’s water status. Given how simple it was, I decided to add a few other sensors to the Arduino: temperature, humidity, and light level. With all this information nicely ingested into Splunk, I went about creating a dashboard to display the health of my now over-engineered garden.

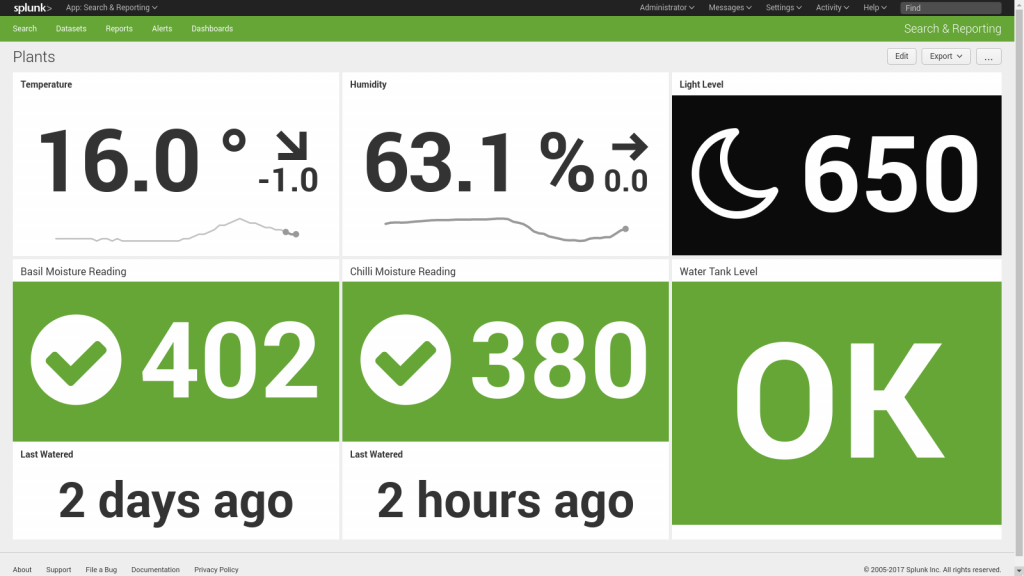
The overview dashboard for my garden. The top left and centre show current temperature and humidity, including trend, while the top right shows the current light reading. The bottom left and centre show current moisture reading and the last time each plant was watered. The final panel in the bottom right gives the status of the tank's water level.

With this data coming in, I was able to easily understand what was going on with my plants:

  1. I can easily see the effect watering has on my plants, via the moisture levels (lower numbers = more moisture). I generally aim to maintain the moisture level between 300 and 410. Over 410 and the soil starts getting quite dry, while putting the moisture probe in a glass of water reads 220—so it’s probably best to keep it well above that.
  2. My basil was much thirstier than my chilli bush, requiring about 50–75% more water.
  3. It can get quite hot in the sun on our windowsill. One fortnight in February recorded nine 37+ degree days, with the temperature hitting 47 degrees twice during that period.
  4. During the height of summer, the tank typically holds 7–10 days’ worth of water.

Having this data in Splunk also alerts me to when the system isn't working properly. On one occasion in February, I noticed that my dashboard was consistently displaying that the basil pot had been watered within the last 15 minutes. After a few minutes looking at the data, I was able to figure out what was going on.

Using the above graph from my garden’s Splunk dashboard, I could see that my setup had correctly identified that the basil pot needed to be watered and had watered it—but I wasn't seeing the expected change in the basil’s moisture level. So the next time the system checked the moisture level, it saw that the plant needed to be watered, watered it again, and the cycle continued. When I physically checked the system, I could see that the Arduino was correctly setting the relay and turning the pump on, but no water was flowing. After further investigation, I discovered that the pump had died. Once I had replaced the faulty pump, everything returned to normal.

Since my initial design, I have upgraded the system a few times. It now joins a number of other Arduinos I have around the house, sending data via cheap radio transmitters to a central Arduino that then forwards the data on to Splunk. Aside from the pump dying, the garden system has been functioning well for the past six months, providing me with data that I will use to continue making the system a bit smarter about how and when it waters my plants.

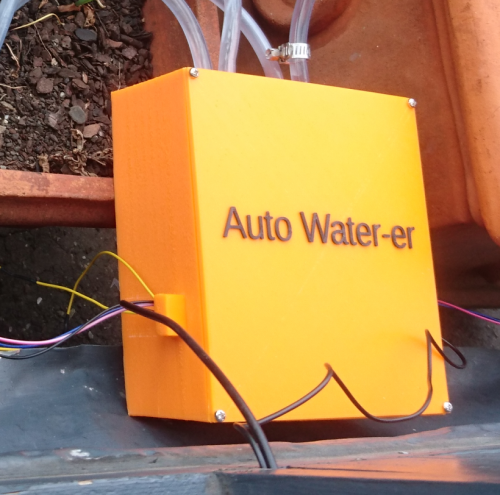
I've also 3D printed a nice case in UV-resistant plastic, so my gardening system no longer has to live in an old lunchbox.

Our team on the case