JDS has a proud history of working with industry-leading tools and ensuring they provide value for your business. We are excited to share that one of our major partners, Cisco, has announced their much-anticipated Full-Stack Observability (FSO) Platform at CiscoLive Las Vegas this month. We have been looking forward to the launch of the FSO platform which will help us unlock much greater value in Observability data. This will benefit our clients by allowing them to bring in a wider variety of data across the app and infrastructure stack, enriched with business context and activity data so you can ensure your tech is optimised for maximum business performance.
https://www.cisco.com/c/en_ca/solutions/full-stack-observability.html?socialshare=lightbox-fso-video
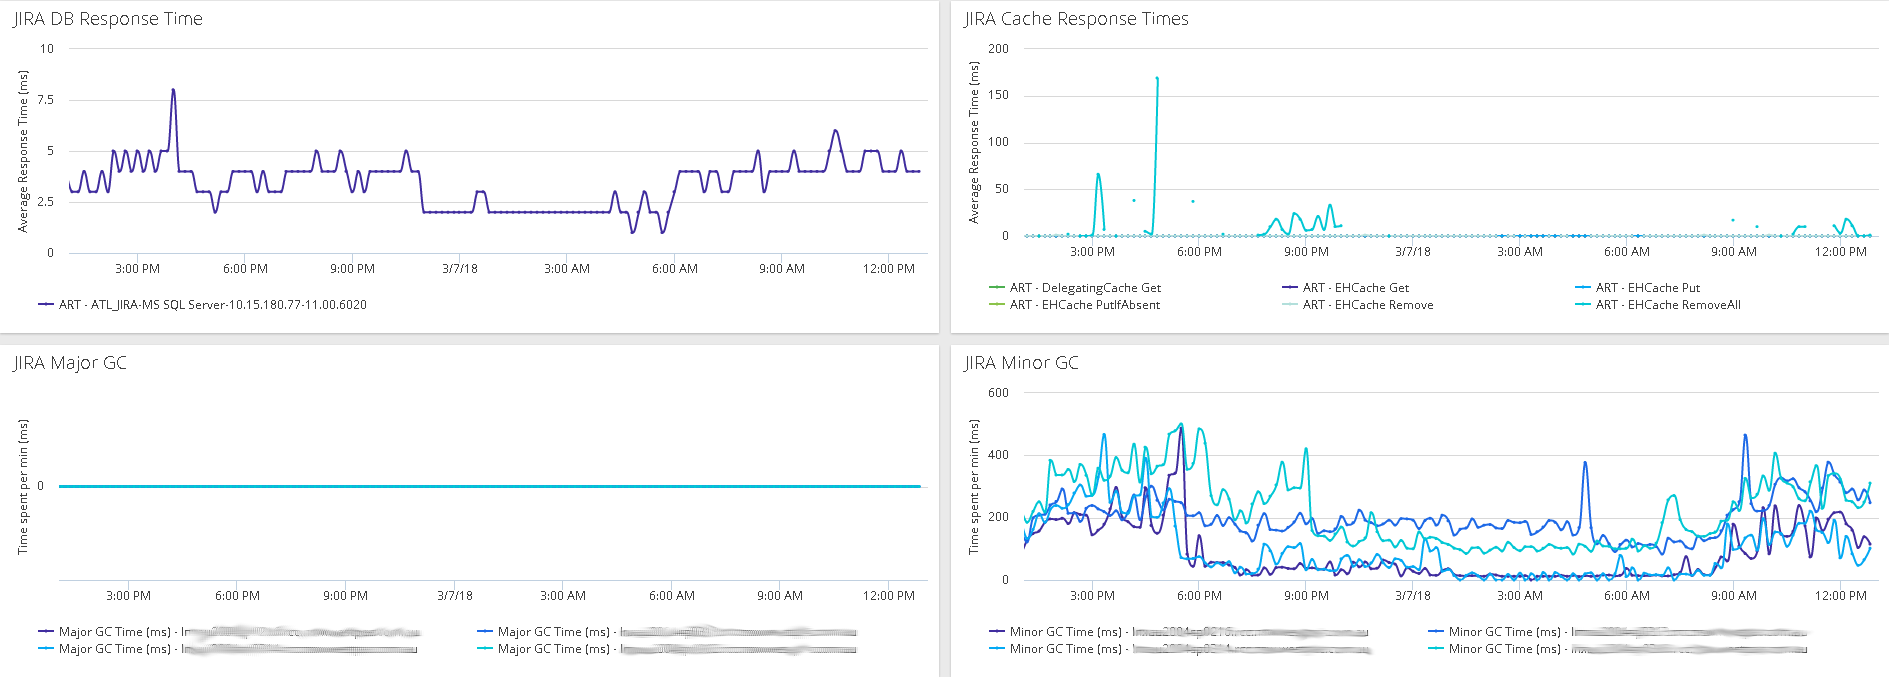
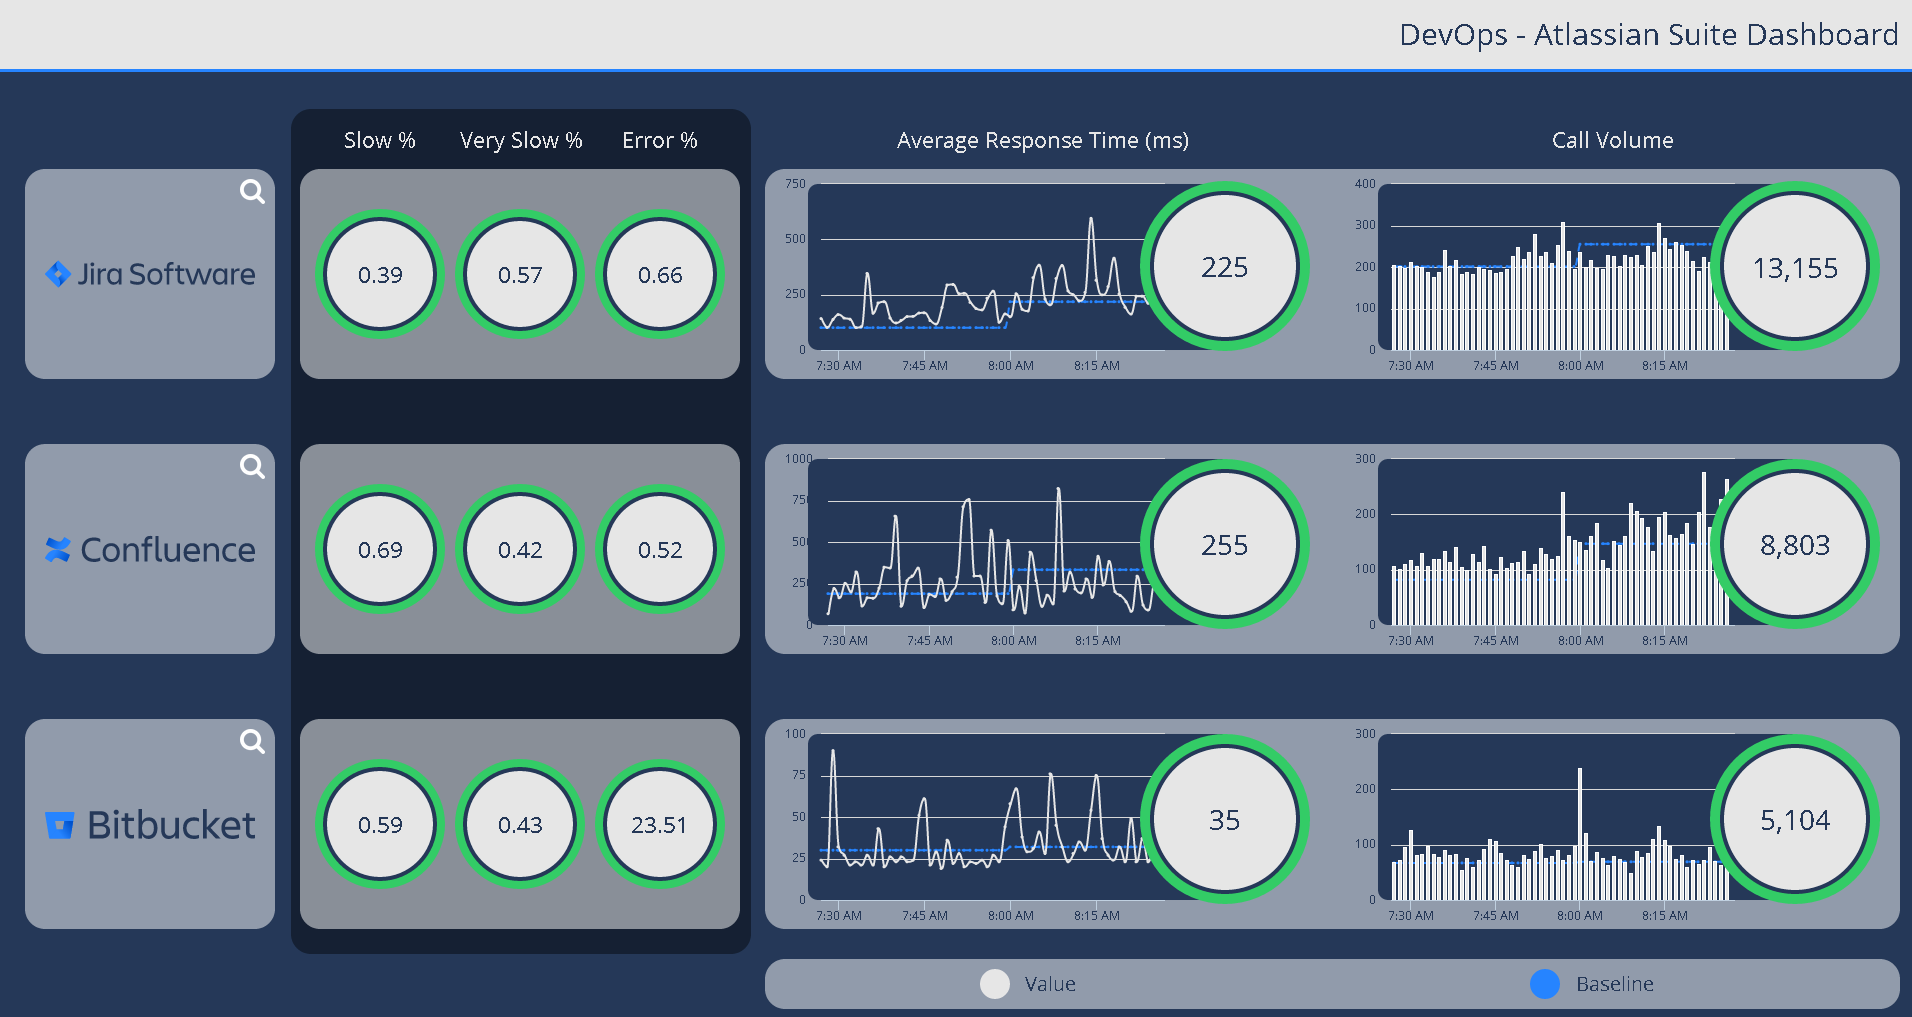
Most of our clients are involved in some level of digital transformation – be it moving to cloud-native or SaaS stacks, simplifying customer experiences with digital apps, or streamlining business processes with smart tech. This has typically meant a lot more moving parts and every time something isn’t right, a new needle-in-the-haystack challenge is presented. Being able to observe a customer’s journey and experience, including all of the technical and business elements involved, pinpoint problems or identify high-value optimisations, is critical for operational success.
Businesses need the ability to get fast answers to questions like “where is slowness occurring”, “how can we optimise resource usage” or “where can we improve conversion.” Cisco FSO Platform has a ubiquitous and context-rich data platform, with flexible query tools and packaged solutions, to ensure IT is working at its best.
An Overview of the Cisco FSO Platform
The Cisco FSO Platform was designed from the ground up to provide end-to-end visibility across complex, hybrid and multi-cloud environments. It delivers an extensible, entity-based data model that provides the flexibility to ingest any observability data with business context. By leveraging OpenTelemetry and harnessing the power of Metrics, Events, Logs, and Traces (MELT) to seamlessly collect and analyse data generated by any source, the FSO Platform is a versatile and comprehensive solution to capture observability data across an enterprise.
Right out of the gate there are features for application visibility, security insights, resource and cost optimisation, plus partner-led tools for financial visibility and capacity planning.
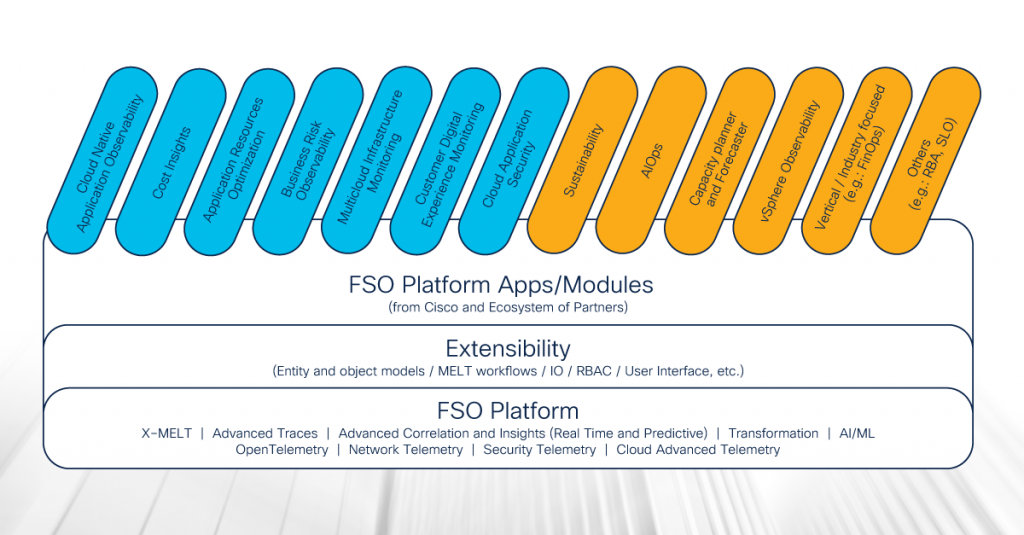
Cloud Native Application Observability
One of the standout features of the Cisco FSO Platform is its Cloud Native Application Observability capability. This feature provides deep visibility into cloud-native environments, allowing organisations to monitor and troubleshoot their applications with ease. By providing insights into digital experiences, ensuring performance alignment with end-user expectations, prioritising actions, and reducing risks, businesses can gain valuable insights into the performance and behaviour of their applications. This allows customers the ability to identify and resolve issues before they impact users.
The Verdict
The Cisco FSO Platform is an innovative solution that offers an impressive suite of features that enable businesses to enhance digital experiences, mitigate risks, and drive operational efficiency.
The Platform represents a significant milestone in Cisco’s FSO strategy, and shows their commitment to providing a comprehensive observability solution for clients. While other observability platforms can ingest data at scale, they face challenges in understanding and building a view of services. Cisco’s approach was to build a solution that utilises an entity model at its core, which can be tailored to overcome these limitations. This is crucial with the complexity of modern applications spanning cloud, on-premise, microservices, SaaS, and serverless technologies, yet still needing to understand your customers’ digital journey and experience as they interact with your business.
We will be keeping a keen eye on developments and look forward to sharing our experiences as we work with our customers to rationalise their observability strategies, harnessing the unique capabilities of the FSO Platform.