Category: Case Study

Splunk

As a Splunk Elite partner, JDS has a dedicated Splunk practice with expertise spanning ITOps, AIOps, and Security. JDS has proven to be trusted advisors and provide a safe pair of hands to architect, implement and manage Splunk for many organisations across a wide range of use cases.


IT Service Intelligence / Business Service Insights

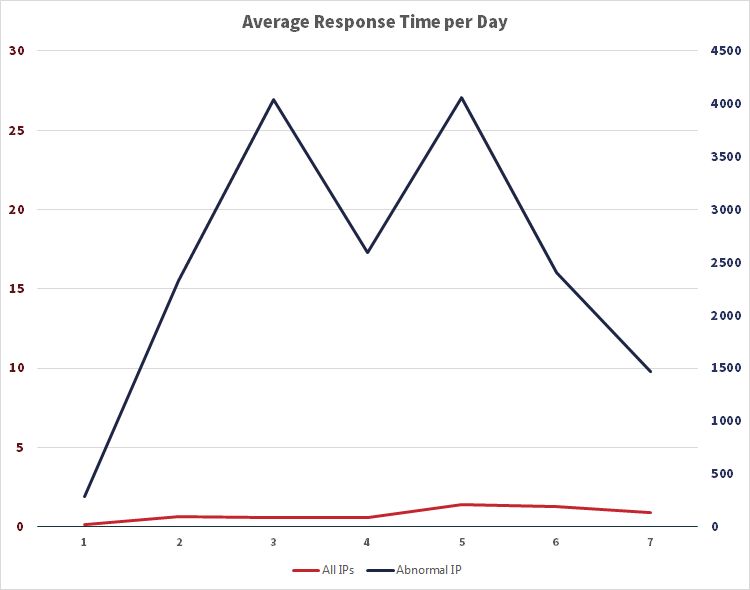
Customisable business dashboards, mapped to key performance indicators, can provide invaluable real-time visibility into the health of your digital services. Our skilled JDS team have extensive experience in implementing Splunk’s unique platform to assist organisations ensure uninterrupted access to critical services.


IT Operations, Analytics and AIOps

JDS can transform your entire IT Ops approach with a suite of tools that put AI and machine learning at their core, allowing you to predict and prevent, instead of triage and react.  We enable a genuine understanding of the complete environment to get ahead of issues before they occur.


End to End Application Visibility

Gaining End-to-End Visibility means unifying business, application and infrastructure health for full-stack observability of critical apps and services.  With JDS and Splunk, gain the ability to visualise the health of your services at a glance, and make smarter, data-driven decisions.

Enterprise Security and Analytics

Splunk is renowned for its Security Information and Event Management (SIEM) and Security Orchestration, Automation and Response (SOAR) capabilities and JDS has the experience to establish and build out these capabilities along with the integrations to related systems.


Call Centre Visibility

Having insights into how your call centre is responding to customers can improve efficiency, effectiveness, quality of service and the overall customer experience. Using Splunk’s Contact Center Analytics, JDS can unlock this vital visibility, whether you’re working with centralized call centres or remote agents.

Splunk Cloud Migrations

JDS will help you to minimise downtime whilst maximising your architecture when migrating to Splunk Cloud. Our experts lead a collaborative engagement to make the transition as seamless as possible, while maintaining full visibility into your infrastructure before, during and after migration.

Success Stories

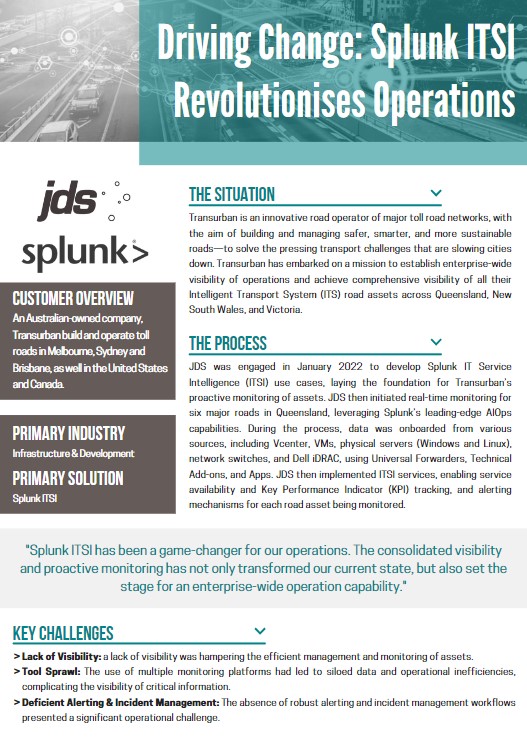
Transforming operations at Transurban with Splunk ITSI >

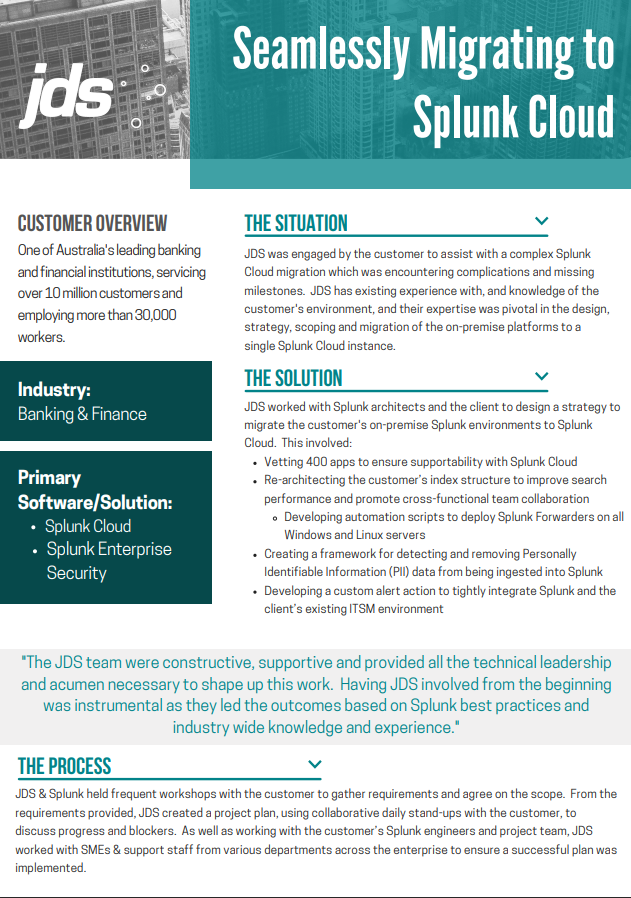
Helping one of Australia’s largest banking institutions migrate seamlessly to Splunk Cloud >

Unifying Insights with a Splunk ITSI and Observability Cloud Integration >

How synthetic monitoring will improve application performance for a large bank

JDS is currently working with several businesses across Australia to implement our custom synthetic monitoring solution, Active Robot Monitoring—powered by Splunk. ARM is a simple and effective way of maintaining the highest quality customer experience with minimal cost. While other synthetic monitoring solutions operate on price-per-transaction model, ARM allows you to conduct as many transactions as you want using under the umbrella of your Splunk investment. We recently developed a Splunk ARM solution for one of the largest banks in Australia and are in the process of implementing it. Find out more about the problem presented, our proposed solution, and the expected results below.


The problem

A large Australian bank (‘the Bank’) needs to properly monitor the end-to-end activity of its core systems/applications. This is to ensure that the applications are available and performing as expected at all times. Downtime or poor performance, even for only a few minutes, could potentially result in great loss of revenue and reputation damage. While unscheduled downtime or performance degradation will inevitably occur at some point, the Bank wants to be notified immediately of any performance issues. They also want to identify the root cause of the problem easily, resolve the issue, and restore expected performance and availability as quickly as possible. To achieve this, the Bank approached JDS for a solution to monitor, help triage, and highlight error conditions and abnormal performance.

The solution

JDS proposed implementing the JDS Active Robot Monitoring (ARM) Splunk application. ARM is a JDS-developed Splunk application which utilises scripts written in a variety of languages (e.g. Selenium) with custom built Splunk dashboards. In this case, Selenium is used to emulate actual users interacting with the web application. These interactions or transactions will be used to determine if the application is available, whether a critical function of the application is working properly, and what the performance of the application is like. All that information will be recorded in Splunk and used for analysis.

Availability and performance metrics will be displayed in dashboards, which fulfils several purposes—namely providing management with a summary view of the status of applications and support personnel with more information to help identify the root cause of the problem efficiently. In this case, Selenium was chosen as it provides for complete customisations not available in other similar offerings in the synthetic monitoring segment, and when coupled with Splunk’s analytical and presentation capability, provides the best solution to address the Bank’s problem.

The expected results

With the implementation of the JDS ARM application at the Bank, availability, and performance of their core applications is expected to improve and remain at a higher standard. Downtime, if it occurs, will be quickly rectified as support personnel will be alerted immediately and have access to all the vital data required to do a root cause analysis of the problem quickly. Management will have a better understanding of the health of the application and will be able to assign valuable resources more effectively to work on it.

What can ARM do for your business?

Throughout the month of November 2017, JDS is open to registrations for a free on-site workshop at your business. We will discuss Active Robot Monitoring and how it could benefit your organisation specifically. To register for this exclusive opportunity,  please enter your information below and one of our account executives will contact you to set up a time to meet at your location.

Case Study: Netwealth bolster their security with Splunk

The prompt and decision

"As a financial services organisation, information security and system availability are core to the success of our business. With the business growing, we needed a solution that was scalable and which allowed our team to focus on high-value management tasks rather than on data collection and review."

Information security is vital to modern organisations, and particularly for those that deal in sensitive data, such as Netwealth. It is essential to actively assess software applications for security weaknesses to prevent exploitation and access by third parties, who could otherwise extract confidential and proprietary information. Security monitoring looks for abnormal behaviours and trends that could indicate a security breach.

"The continued growth of the business and the increased sophistication of threats prompted us to look for a better way to bring together our security and IT operations information and events," explains Chris Foong, Technology Infrastructure Manager at Netwealth. "Advancements in the technology available in this space over the last few years meant that a number of attractive options were available."

The first stage in Netwealth’s project was to select the right tool for the job, with several options short-listed. Each of these options was pilot tested, to establish which was the best fit to the requirements—and Splunk, with its high versatility and ease of use, was the selected solution.

The power in the solution comes from Splunk’s ability to combine multiple real-time data flows with machine learning and analysis which prioritises threats and actions, and the use of dynamic visual correlations and on-demand custom queries to more easily triage threats. Together, this empowers IT to make informed decisions.

Objective

Netwealth’s business objective was to implement a security information and event management (‘SIEM’) compliant tool to enhance management of security vulnerabilities and reporting. Their existing tool no longer met the expanding needs of the business, and so they looked to Splunk and JDS to provide a solution.

Approach

Netwealth conducted a proof of concept with various tools, and Splunk was selected. JDS Australia, as Splunk Implementation Partner, provided licensing and expertise.

IT improvements

Implementing Splunk monitoring gave Netwealth enhanced visibility over their security environment, and the movement of sensitive data through the business. This enabled them to triage security events and vulnerabilities in real time.

About Netwealth

Founded in 1999, Netwealth was established to provide astute investors and wealth professionals with a better way to invest, protect and manage their current and future wealth. As a business, Netwealth seeks to enable, educate and inspire Australians to see wealth differently and to discover a brighter future.

Netwealth offers a range of innovative portfolio administration, superannuation, retirement, investment, and managed account solutions to investors and non-institutional intermediaries including financial advisers, private clients, and high net worth firms.

Industry

Financial Services

Primary applications

  • Office365
  • Fortigate
  • IIS
  • Juniper SRX
  • Microsoft DNS
  • Microsoft AD and ADFS (Active Directory Federation Services)
  • JBoss (Java EE Application Server)
  • Fortinet

Primary software

  • Splunk Enterprise
  • Splunk Enterprise Security (application add-on)

The process

Now that Splunk had been identified as the best tool for the job, it was time to find an Implementation Partner—and that’s where JDS came in. JDS, as the most-certified Australian Splunk partner, was the natural choice. "JDS provided Splunk licensing, expertise on integrating data sources, and knowledge transfer to our internal team," says Foong.  

An agile, project managed approach was taken.  

  1. Understand the business requirements and potential threats associated with Netwealth’s environment.
  2. Identify the various services that required security monitoring.
  3. Identify the data feed for those services.
  4. Deploy and configure core Splunk.
  5. Deploy the Enterprise Security application onto Splunk.
  6. Configure the Enterprise Security application to enable features. These features gave visibility into areas of particular concern.

The JDS difference

For this project, JDS "assisted Netwealth in deploying and configuring Splunk, and gaining confidence in Splunk Enterprise Security," explains the JDS Consultant on the case. "We were engaged as a trusted partner with Splunk, and within hours of deployment, we had helped Netwealth to gain greater visibility of the environment."

JDS were able to leverage their Splunk expertise to give added value to the client, advising them on how to gain maximum value in terms of both project staging, and in the onboarding of new applications. "We advocated a services approach—start by designing the dashboard you want, and work backwards towards the data required to build that dashboard."

"The JDS team worked well with our team, were knowledgeable about the product, and happy to share that knowledge with our team," says Netwealth’s Chris Foong. "They delivered what they said they would, and didn’t under- or over-sell themselves. We would work with them again."

End results

Chris Foong says that Netwealth was looking for "improved visibility over security and IT operations information and events, to aid in faster response and recovery"—and the project was a success on all counts.

"The project was delivered on time and to budget, and Splunk is now capturing data from all the required sources," adds Foong. "We also identified a number of additional use cases, over and above the base Enterprise Security case, such as rapidly troubleshooting performance degradation."

Now that Netwealth has implemented Splunk, the software has further applicability across the business. The next step is continuing to leverage Splunk, and JDS will be there to help.

Business Benefits

  • Gave Netwealth better visibility into the organisation’s security posture
  • Presents the opportunity for leveraging of Splunk in other areas of the business; for example, marketing
  • Allows Netwealth to have greater visibility into application and business statistics, with the potential to overlay machine learning and advanced statistical analysis of this business information

Implementing an electronic signature in ALM


This is where organisations like the FDA (Food and Drug Administration in the United States) and TGA (Therapeutic Goods Administration in Australia) come in, enforcing regulatory controls around all aspects of the manufacturing process to minimise risk and ensure a high level of quality.

These regulatory bodies understand that effective quality assurance goes much further than just regulating the raw materials and manufacturing process. Any software used to control or support the manufacturing process must also adhere to strict quality standards, because a bug in the software can lead to problems in manufacturing with real-world consequences for patients. Software quality assurance can therefore literally be a matter of life or death l.

To ensure that medical manufacturers conduct satisfactory software testing and maintain the required quality assurance standards, the FDA have published the General Principles of Software Validation document which “outlines general validation principles that the Food and Drug Administration (FDA) considers to be applicable to the validation of medical device software or the validation of software used to design, develop, or manufacture medical devices.”

The JDS solution

JDS Australia recently implemented HPE Application Lifecycle Management (ALM) for one of our clients, a manufacturer of medicine delivering more than 10,000 patient doses per week to hospitals in Australia and overseas. ALM is a software testing tool that assists with the end-to-end management of the software testing lifecycle. This includes defining functional and non-functional requirements for a given application and creating test cases to confirm those requirements are met. It also manages all aspects of test execution, the recording and managing of defects, and reporting across the entire testing effort. ALM enables an organisation to implement and enforce their test strategy in a controlled and structured manner, while providing a complete audit trail of all the testing that was performed.

To comply with the FDA requirements, our client required customisation of ALM to facilitate approvals and sign-off of various testing artefacts (test cases, test executions, and defects). The FDA stipulates that approvals must incorporate an electronic signature that validates the user’s identity to ensure the integrity of the process. As an out-of-the-box implementation, ALM does not provide users with the ability to electronically sign artefacts. JDS developed the eSignature add-in to provide this capability and ensure that our client conforms to the regulatory requirements of the FDA.

The JDS eSignature Add-in was developed in C# and consists of a small COM-aware dll file that is installed and registered on the client machine together with the standard ALM client. The eSignature component handles basic field-level checks and credential validation, while all other business rules are managed from the ALM Workflow Customisation. This gives JDS the ability to implement the electronic signature requirements as stipulated by the FDA, while giving us the flexibility to develop customer-specific customisations and implement future enhancements without the need to recompile and reinstall the eSignature component.

Let’s look at a simple test manager approval for a test case to see how it works.

To start with, new “approval” custom fields are added to the Test Plan module which may contain data such as the approval status, a reason/comment and the date and time that the approval was made. These fields are read-only with their values set through the eSignature Workflow customisation. A new “Approve Test” button is added to the toolbar. When the user clicks this button, the Test Approvals form is presented to the user who selects the appropriate approval status, provides a comment, and enters their credentials. When the OK button is clicked, the eSignature component authenticates the user in ALM using an API function from the HPE Open Test Architecture (OTA) COM library.

If the user is successfully authenticated, eSignature passes the relevant information to the ALM workflow script which sets the appropriate field values. The approvals functionality can be further customised to do things such as making the test case read-only or sending an email to the next approver in line to review and approve the test case.

As it currently stands, the eSignature has been implemented in three modules of ALM – Test Plan for test cases that require two levels of review and approval, Test Lab for test execution records that require three levels of review and approval, and Defects to manage the assignment and approvals of defects. This can easily be expanded to include other modules, such as the approvals of test requirements or software releases.

The JDS eSignature add-in has a very small footprint, is easy to install and configure, and provides our clients with the ability to effectively implement an electronic signature capability as part of their software testing strategy.

If you have compliance requirements or are seeking ways to automate your test management processes, contact our support team at JDS Australia. Our consultants are highly skilled across a range of software suites and IT platforms, and we will work with your business to develop custom solutions that work for you.

Contact us at:

T: 1300 780 432

E: [email protected]

The Splunk Gardener

The Splunk wizards at JDS are a talented bunch, dedicated to finding solutions—including in unexpected places. So when Sydney-based consultant Michael Clayfield suffered the tragedy of some dead plants in his garden, he did what our team do best: ensure it works (or ‘lives’, in this case). Using Splunk’s flexible yet powerful capabilities, he implemented monitoring, automation, and custom reporting on his herb garden, to ensure that tragedy didn’t strike twice.

My herb garden consists of three roughly 30cm x 40cm pots, each containing a single plant—rosemary, basil, and chilli. The garden is located outside our upstairs window and receives mostly full sunlight. While that’s good for the plants, it makes it harder to keep them properly watered, particularly during the summer months. After losing my basil and chilli bush over Christmas break, I decided to automate the watering of my three pots, to minimise the chance of losing any more plants. So I went away and designed an auto-watering setup, using soil moisture sensors, relays, pumps, and an Arduino—an open-source electronic platform—to tie it all together.

Testing the setup by transferring water from one bottle to another.

I placed soil moisture sensors in the basil and the chilli pots—given how hardy the rosemary was, I figured I could just hook it up to be watered whenever the basil in the pot next to it was watered. I connected the pumps to the relays, and rigged up some hosing to connect the pumps with their water source (a 10L container) and the pots. When the moisture level of a pot got below a certain level, the Arduino would turn the equivalent pump on and water it for a few seconds. This setup worked well—the plants were still alive—except that I had no visibility over what was going on. All I could see was that the water level in the tank was decreasing. It was essential that the tank always had water in it, otherwise I'd ruin my pumps by pumping air.

To address this problem, I added a float switch to the tank, as I was aiming to set it up so I could stop pumping air if I forgot to fill up the tank. Using a WiFi adapter, I connected the Arduino to my home WiFi. Now that the Arduino was connected to the internet, I figured I should send the data into Splunk. That way I'd be able to set up an alert notifying me when the tank’s water level was low. I'd also be able to track each plant’s moisture levels.

The setup deployed: the water tank is on the left; the yellow cables coming from the tank are for the float switch; and the plastic container houses the pumps and the Arduino, with the red/blue/black wires going to the sensors planted in the soil of the middle (basil) and right (chilli) pots. Power is supplied via the two black cables, which venture back inside the house to a phone charger.

Using the Arduino’s Wifi library, it’s easy to send data to a TCP port. This means that all I needed to do to start collecting data in Splunk was to set up a TCP data input. Pretty quickly I had sensor data from both my chilli and basil plants, along with the tank’s water status. Given how simple it was, I decided to add a few other sensors to the Arduino: temperature, humidity, and light level. With all this information nicely ingested into Splunk, I went about creating a dashboard to display the health of my now over-engineered garden.

The overview dashboard for my garden. The top left and centre show current temperature and humidity, including trend, while the top right shows the current light reading. The bottom left and centre show current moisture reading and the last time each plant was watered. The final panel in the bottom right gives the status of the tank's water level.

With this data coming in, I was able to easily understand what was going on with my plants:

  1. I can easily see the effect watering has on my plants, via the moisture levels (lower numbers = more moisture). I generally aim to maintain the moisture level between 300 and 410. Over 410 and the soil starts getting quite dry, while putting the moisture probe in a glass of water reads 220—so it’s probably best to keep it well above that.
  2. My basil was much thirstier than my chilli bush, requiring about 50–75% more water.
  3. It can get quite hot in the sun on our windowsill. One fortnight in February recorded nine 37+ degree days, with the temperature hitting 47 degrees twice during that period.
  4. During the height of summer, the tank typically holds 7–10 days’ worth of water.

Having this data in Splunk also alerts me to when the system isn't working properly. On one occasion in February, I noticed that my dashboard was consistently displaying that the basil pot had been watered within the last 15 minutes. After a few minutes looking at the data, I was able to figure out what was going on.

Using the above graph from my garden’s Splunk dashboard, I could see that my setup had correctly identified that the basil pot needed to be watered and had watered it—but I wasn't seeing the expected change in the basil’s moisture level. So the next time the system checked the moisture level, it saw that the plant needed to be watered, watered it again, and the cycle continued. When I physically checked the system, I could see that the Arduino was correctly setting the relay and turning the pump on, but no water was flowing. After further investigation, I discovered that the pump had died. Once I had replaced the faulty pump, everything returned to normal.

Since my initial design, I have upgraded the system a few times. It now joins a number of other Arduinos I have around the house, sending data via cheap radio transmitters to a central Arduino that then forwards the data on to Splunk. Aside from the pump dying, the garden system has been functioning well for the past six months, providing me with data that I will use to continue making the system a bit smarter about how and when it waters my plants.

I've also 3D printed a nice case in UV-resistant plastic, so my gardening system no longer has to live in an old lunchbox.

Our team on the case

Using Splunk and Active Robot Monitoring to resolve website issues

Recently, one of JDS’ clients reached out for assistance, as they were experiencing inconsistent website performance. They had just moved to a new platform, and were receiving alerts about unexpectedly slow response times, as well as intermittent logon errors. They were concerned that, were the reports accurate, this would have an adverse impact on customer retention, and potentially reduce their ability to attract new customers. When manual verification couldn’t reproduce the issues, they called in one of JDS’ sleuths to try to locate and fix the problem—if one existed at all.

The Plot Thickens

The client’s existing active robot monitoring solution using the HPE Business Process Monitor (BPM) suite showed that there were sporadic difficulties in loading pages on the new platform and in logging in, but the client was unable to replicate the issue manually. If there was an issue, where exactly did it lie?

Commencing the Investigation

The client had deployed Splunk and it was ingesting logs from the application in question—but its features were not being utilised to investigate the issue.

JDS consultant Danesen Narayanen entered the fray and was able to use Splunk to analyse the data received. He could therefore immediately understand the issue the client was experiencing. He confirmed that the existing monitoring solution was reporting the problem accurately, and that the issue had not been affecting the client’s website prior to the re-platform

Using the data collected by HPE BPM as a starting point, Danesen was able to drill down and compare what was happening with the current system on the new platform to what had been happening on the old one. He quickly made several discoveries:

1. There appeared to be some kind of server error.

Since the re-platform, there had been a spike in a particular server error. Our JDS consultant reviewed data from the previous year, to see whether the error had happened before. He noted that there had previously been similar issues, and validated them against BPM to determine that the past errors had not had a pronounced effect on BPM—the spike in server errors seemed to be a symptom, rather than a cause.

Database deadlocks were spiking.
Database deadlocks were spiking
It was apparent that the error had happened before

2. There seemed to be an issue with user-end response time.

Next, our consultant used Splunk to look at the response time by IP addresses over time, to see if there was a particular location being affected—was the problem at server end, or user end? He identified one particular IP address which had a very high response time. What’s more, this was a public IP address, rather than one internal to the client. It seemed like there was a end-user problem—but what was the IP address that was causing BPM to report an issue?

Daily response time for all IPs (left axis), and for the abnormal IP (right axis). All times are in seconds.

Tracking Down the Mystery IP Address

At this point our consultant called for the assistance of another JDS staff member, to track down who owned the problematic IP address. As it turned out, the IP address was owned by the client, and was being used by a security tool running vulnerability checks on the website. After the re-platform, the tool had gone rogue: rather than running for half an hour after the re-platform, it continued to open a number of new web sessions throughout the day for several days.

The Resolution

Now that the culprit had been identified, the team were quickly able to log in to the security tool to turn it off, and the problem disappeared. Performance and availability times returned to what they should be, BPM was no longer reporting issues, and the client’s website was running smoothly once more. Thanks to the combination of Splunk’s power, HPE's active monitoring tools, and JDS’ analytical and diagnostic experience, resolution was achieved in under a day.

Case Study: CitiPower and Powercor take action to ensure quality

“Technology underpins the ability of CitiPower and Powercor to safely and effectively deliver power to more than a million customers. It’s critical that our applications are current, functioning and available,” says Fiona Hocking, CSA assurance team leader, Powercor.

Objective

To deliver top-quality, high-performing business applications that are current, functioning and available

Challenge

Develop an effective Quality Assurance (QA) discipline for application lifecycles across the enterprise

IT improvements

  • Provides HP Quality Centre (QC) to application groups with zero outages
  • Provides a holistic view of an application testing status
  • Allows application teams to manage up to 30 test cycles with 500 test cases, resulting in the management of over 6,500 defects

About the Client

CitiPower and Powercor are Australia’s leading electricity distributors owned by Cheung Kong Infrastructure Ltd (CKI) and Power Assets Holdings Ltd. Combined, the group operates the largest electricity distribution network in the state of Victoria, servicing over a million customers.

Operating in a highly controlled industry and tasked with providing critical services around the clock, the group relies heavily on its IT infrastructure to deliver energy to customers and to meet regulatory requirements.

This infrastructure is complex to say the least. With over 11 critical business applications, 2,000 users, and multifaceted interfaces to a central information hub for the business facing systems alone, delivery expectations on the IT department are high. Field staff, the group and the government regulator all need real-time information from the electricity network, such as usage patterns, meter data and consumption. Information accuracy and availability can mean the difference between someone getting power or not. Significant penalties apply for missing the mark, so it’s important that the IT department gets it right.

Industry

Power

Primary software

  • HP Quality Center

High availability

To deliver on its strategic objectives, the group mandates that its IT department provides high-performing business applications with a 99.8 percent availability rate. There is zero tolerance for level one defects.

As an internal service provider, the Quality Assurance Team had to define how to best facilitate enterprise testing capabilities with limited resources and tight timeframes. At any one time, an application could be managing 20 to 30 test cycles, with over 6,500 defects being handled across its project lifecycle. The Quality Assurance (QA) Team quickly identified that HP Quality Centre (QC) could be of immediate benefit to application owners. Providing a holistic view of an application’s testing status would allow an application owner to assess priorities, allocate resources and deliver quality applications on time and to specification.

In order to be effective and highly responsive when called upon by stakeholders, the QA Team identified three key areas for HP QC success. Firstly, they enlisted support services from HP Platinum Partner JDS Australia to ensure that HP QC continued to be operational with fast issue resolution.

“When it comes to HP Quality Center, JDS keeps the lights switched on. We simply don’t have to worry about HP QC not being available or operational. JDS ensures that we are aware of product developments, new features and functions, and that our system is kept healthy. I know that any time I call them, they can answer my questions. Our HP QC users have aggressive targets, and using JDS as support means that we can keep our users happy,” said Hocking.

Tester training

Secondly, the QA Team packaged training programs that could be easily rolled out when required. As each testing requirement is based on secondment, an application owner can nominate different testers as deemed appropriate. Given that testing groups have often never used testing tools, the QA Team has to equip new testers with the skills needed to get the job done.

“HP QC is very customisable to meet the needs of each specific project. This means that we have to be nimble enough to roll out project-specific training,” says Hocking. “The fact HP QC is intuitive makes the training process easier. In some cases, we can train large groups on the basics in less than thirty minutes. Thirdly, the QA Team assists project teams by helping define testing requirements, developing test scripts, and leveraging HP QC for optimal outcomes.

“Since we were tasked with rolling out HP QC capabilities across the enterprise, we have increased its use by 78 percent and improved user-uptake by 67 per cent.”
With a solid QA platform in place that is supported by JDS, CitiPower and Powercor are now better placed to maintain quality applications under pressure and amidst rapid change.

When the government of Victoria announced its smart meter program for improved accuracy of billing, faster connections and disconnections and real-time usage information, the group welcomed the challenge. The project includes a tight time-frame for the installation of 1.2 million smart meters that can transmit two-way data to a central repository.

Leveraging the capabilities provided by the QA Team, the Advanced Metering Infrastructure (AMI) Network Management System (NMS) support team used HP QC to drive the testing. HP QC is used to ensure that a third-party vendor meets Service Level Agreements (SLAs), that the AMI NMS application (Utility IQ) functions as it is supposed to, and that changes to the application do not present performance risks. HP QC allows the application owner to deliver quality solutions that meet company standards.

Field Mobile Applications

Further adhering to government regulations and business drivers, the group has deployed the Ventyx Service Suite to enable the accurate capture of real-time information from the field through over 500 PDAs. Adopting a thorough end-to-end testing process, the application group has aligned business expectations and security issues with the application itself, according to Alan King, manager, Field Mobile Applications. Incorporating HP QC allowed the team to effectively manage over 500 test cases and improve application functionality with the third-party vendor, based on discovered SLA deficiencies.

“HP QC allows us to manage our vendors and internal customers, as we can negotiate patches and articulate the priorities. It also improves our service levels to our internal customers as they have visibility into the defects and can contribute to the priority fix list,” says King.

Hocking adds: “selecting a high performing tool such as HP QC was the first step but having a skilled group of testing and monitoring consultants behind us makes all the difference. Put simply, JDS keeps the testing technology working so that other critical applications continue to be highly available with minimal defects. We would not have achieved the results without them,” says Hocking.

Powercor and CitiPower will continue to draw upon JDS’s expertise in the areas of technical testing, IT monitoring, and HP Software Support for the future.
“JDS Support has provided outstanding service levels. In the past three years, 60 percent of all support calls have been resolved instantly, and the rest within days,” concludes Hocking. “I can have skilled technicians on-site quickly if I need and can access a large pool of expertise for troubleshooting. With JDS, the Quality Assurance Team has been able to deliver on its service levels and we will continue to work together as we further enhance QA capabilities.”

Business Benefits

  • Rolled out HP Quality Centre across the enterprise to improve uptake of QA processes by 78 percent and increased application performance quality
  • Leveraged HP QC’s capabilities to support application testing for the Smart Meter project
  • Improved quality processes to enable IT application teams to deliver on service levels

Our team on the case

[amoteam max="3" categories="217" item-width="250" item-margin="20" full-width="yes" align="center" panel="right"]

Why choose JDS?

At JDS, our purpose is to ensure your IT systems work wherever, however, and whenever they are needed. Our expert consultants will help you identify current or potential business issues, and then develop customised solutions to suit you.

JDS is different from other providers in the market. We offer 24/7 monitoring capabilities and support throughout the entire application lifecycle. We give your IT Operations team visibility into the health of your IT systems, enabling them to identify and resolve issues quickly.

We are passionate about what we do, working seamlessly with you to ensure you are getting the best possible performance from your environment. All products sold by JDS are backed by our local Tier One support desk, ensuring a stress-free solution for the entire product lifecycle.