Tag: active monitoring

Top 7 benefits of JDS Active Robot Monitoring

JDS has spent a lot of time this month showing how our bespoke synthetic monitoring solution, Active Robot Monitoring with Splunk, is benefitting a wide variety of businesses. ARM has been used to resolve website issues for a major superannuation company and is improving application performance for a large Australian bank. We’re also currently implementing an ARM solution for one of the biggest universities in Australia and a major medical company. Find out more about the benefits of JDS Active Robot Monitoring below.


Summary of ARM

ARM is a capability developed by JDS that enables synthetic performance monitoring for websites, mobile, cloud-based, on-premise, and SaaS apps. It provides IT staff and managers a global view of what’s happening in your environment, as it’s happening. You can then use the customisable results dashboard to easily consume performance data, and drill down to isolate issues by location or transaction layer.

Top 7 benefits of ARM

1. Get an overall picture of an application’s end-to-end performance

How long does it take for your page to load, or for a user to log in? Can they log in? You may be getting green lights from all of the back-end components individually, but not realise the login process is taking three times longer than normal. ARM gives you the full picture, helping you spot performance issues you may not notice in the back-end.

2. Small increase in data ingested

If you’re already using Splunk, the amount of data you ingest with ARM is minimal, meaning you are getting even more out of your enterprise investment at an extremely low cost.

3. Fast time to value

Many IT projects can take years to show a return on investment, but ARM is not one of them. Once implemented, IT and development teams see value fast as their ability to hone in on and resolve issues accelerates and the number of user issues decreases.

4. Performance and availability metrics based on users location

See how your website, system, or application performs in different locations to find out where issues may be occurring and how to fix them.

5. Proactively find and alert on issues before users do

Users discovering glitches or errors is damaging to a business’s reputation. The ARM robots are constantly on the look-out for problems in the system and will alert you when issues arise so you can resolve them before they negatively impact your customers.

6. Monitor performance 24/7, even while users are asleep

Humans sleep; robots don’t. ARM monitors your application 24/7 to ensure even your late-night customers have a stellar user experience.

7. Get unlimited transactions

Unlike other synthetic monitoring tools, which charge on a per-transaction basis (i.e. every user transaction you want to run invites a new charge), ARM allows you unlimited transactions, so you can measure whatever actions you think your users may take.


How synthetic monitoring will improve application performance for a large bank

JDS is currently working with several businesses across Australia to implement our custom synthetic monitoring solution, Active Robot Monitoring—powered by Splunk. ARM is a simple and effective way of maintaining the highest quality customer experience with minimal cost. While other synthetic monitoring solutions operate on price-per-transaction model, ARM allows you to conduct as many transactions as you want using under the umbrella of your Splunk investment. We recently developed a Splunk ARM solution for one of the largest banks in Australia and are in the process of implementing it. Find out more about the problem presented, our proposed solution, and the expected results below.


The problem

A large Australian bank (‘the Bank’) needs to properly monitor the end-to-end activity of its core systems/applications. This is to ensure that the applications are available and performing as expected at all times. Downtime or poor performance, even for only a few minutes, could potentially result in great loss of revenue and reputation damage. While unscheduled downtime or performance degradation will inevitably occur at some point, the Bank wants to be notified immediately of any performance issues. They also want to identify the root cause of the problem easily, resolve the issue, and restore expected performance and availability as quickly as possible. To achieve this, the Bank approached JDS for a solution to monitor, help triage, and highlight error conditions and abnormal performance.

The solution

JDS proposed implementing the JDS Active Robot Monitoring (ARM) Splunk application. ARM is a JDS-developed Splunk application which utilises scripts written in a variety of languages (e.g. Selenium) with custom built Splunk dashboards. In this case, Selenium is used to emulate actual users interacting with the web application. These interactions or transactions will be used to determine if the application is available, whether a critical function of the application is working properly, and what the performance of the application is like. All that information will be recorded in Splunk and used for analysis.

Availability and performance metrics will be displayed in dashboards, which fulfils several purposes—namely providing management with a summary view of the status of applications and support personnel with more information to help identify the root cause of the problem efficiently. In this case, Selenium was chosen as it provides for complete customisations not available in other similar offerings in the synthetic monitoring segment, and when coupled with Splunk’s analytical and presentation capability, provides the best solution to address the Bank’s problem.

The expected results

With the implementation of the JDS ARM application at the Bank, availability, and performance of their core applications is expected to improve and remain at a higher standard. Downtime, if it occurs, will be quickly rectified as support personnel will be alerted immediately and have access to all the vital data required to do a root cause analysis of the problem quickly. Management will have a better understanding of the health of the application and will be able to assign valuable resources more effectively to work on it.

What can ARM do for your business?

Throughout the month of November 2017, JDS is open to registrations for a free on-site workshop at your business. We will discuss Active Robot Monitoring and how it could benefit your organisation specifically. To register for this exclusive opportunity,  please enter your information below and one of our account executives will contact you to set up a time to meet at your location.

Using Splunk and Active Robot Monitoring to resolve website issues

Recently, one of JDS’ clients reached out for assistance, as they were experiencing inconsistent website performance. They had just moved to a new platform, and were receiving alerts about unexpectedly slow response times, as well as intermittent logon errors. They were concerned that, were the reports accurate, this would have an adverse impact on customer retention, and potentially reduce their ability to attract new customers. When manual verification couldn’t reproduce the issues, they called in one of JDS’ sleuths to try to locate and fix the problem—if one existed at all.

The Plot Thickens

The client’s existing active robot monitoring solution using the HPE Business Process Monitor (BPM) suite showed that there were sporadic difficulties in loading pages on the new platform and in logging in, but the client was unable to replicate the issue manually. If there was an issue, where exactly did it lie?

Commencing the Investigation

The client had deployed Splunk and it was ingesting logs from the application in question—but its features were not being utilised to investigate the issue.

JDS consultant Danesen Narayanen entered the fray and was able to use Splunk to analyse the data received. He could therefore immediately understand the issue the client was experiencing. He confirmed that the existing monitoring solution was reporting the problem accurately, and that the issue had not been affecting the client’s website prior to the re-platform

Using the data collected by HPE BPM as a starting point, Danesen was able to drill down and compare what was happening with the current system on the new platform to what had been happening on the old one. He quickly made several discoveries:

1. There appeared to be some kind of server error.

Since the re-platform, there had been a spike in a particular server error. Our JDS consultant reviewed data from the previous year, to see whether the error had happened before. He noted that there had previously been similar issues, and validated them against BPM to determine that the past errors had not had a pronounced effect on BPM—the spike in server errors seemed to be a symptom, rather than a cause.

Database deadlocks were spiking.
Database deadlocks were spiking
It was apparent that the error had happened before

2. There seemed to be an issue with user-end response time.

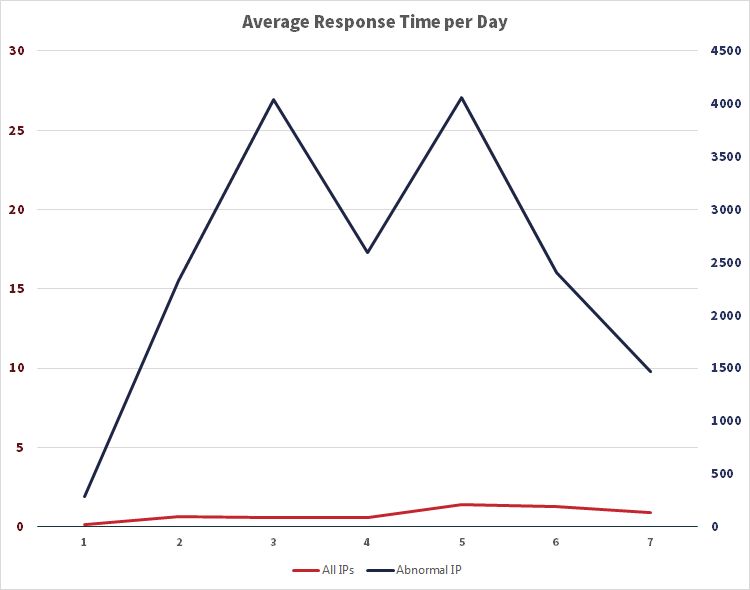
Next, our consultant used Splunk to look at the response time by IP addresses over time, to see if there was a particular location being affected—was the problem at server end, or user end? He identified one particular IP address which had a very high response time. What’s more, this was a public IP address, rather than one internal to the client. It seemed like there was a end-user problem—but what was the IP address that was causing BPM to report an issue?

Daily response time for all IPs (left axis), and for the abnormal IP (right axis). All times are in seconds.

Tracking Down the Mystery IP Address

At this point our consultant called for the assistance of another JDS staff member, to track down who owned the problematic IP address. As it turned out, the IP address was owned by the client, and was being used by a security tool running vulnerability checks on the website. After the re-platform, the tool had gone rogue: rather than running for half an hour after the re-platform, it continued to open a number of new web sessions throughout the day for several days.

The Resolution

Now that the culprit had been identified, the team were quickly able to log in to the security tool to turn it off, and the problem disappeared. Performance and availability times returned to what they should be, BPM was no longer reporting issues, and the client’s website was running smoothly once more. Thanks to the combination of Splunk’s power, HPE's active monitoring tools, and JDS’ analytical and diagnostic experience, resolution was achieved in under a day.