The Problem
JDS Australia works with numerous customers who utilise the force.com platform as the primary interface for their end users (internal and external) to execute business critical services. The flexibility and extensibility of the component based Lightning framework has allowed businesses to customise the platform to meet their specific requirements.
However, many of these companies struggle to monitor, quantify or pinpoint the impact of performance in the Salesforce platform to their end users and ultimately their business. Furthermore, there is limited capability to provide detailed Salesforce information for root cause analysis (e.g. is the problem with a particular lightning component(s) vs core Salesforce platform vs multiple pages?).
The Solution
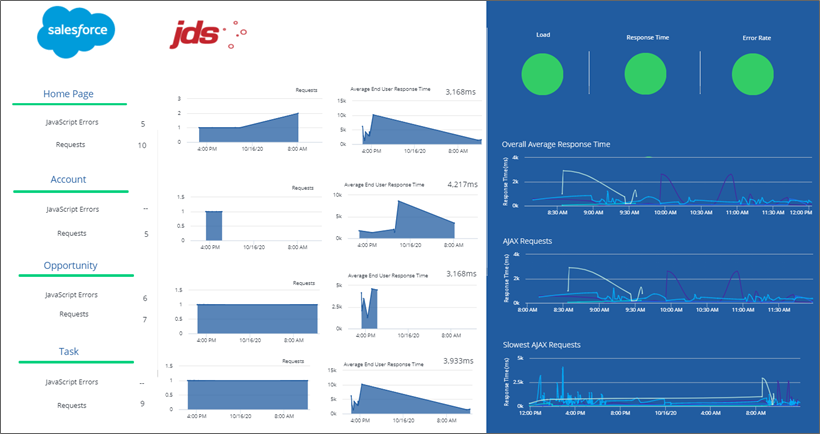
Using AppDynamics Real User Browser Monitoring (RUM) coupled with advanced JavaScript configuration, we have created a solution.
Unlike traditional methods involving logfile or API based monitoring; real user monitoring collects rich metrics from the end users’ perspective. JDS has also further integrated additional custom code to identify AJAX requests and inject page names into the stream and provide business context and make sense of the data.

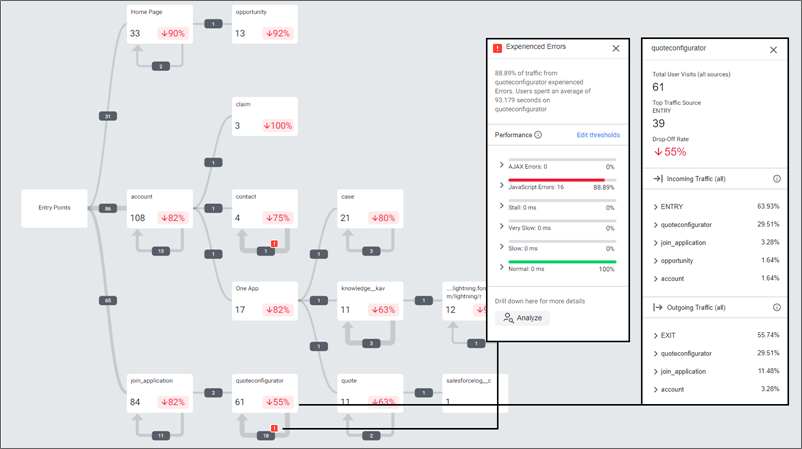
Additionally, AppDynamics RUM is able to identify and dynamically visualise each step of Customer Journeys as they traverse Salesforce, in near real time.
Using the collated metrics these businesses have been able to proactively alert support teams of issues, and also utilise the historic data to analyse customer behaviour to understand how customers are using the platform. For example, expected user journeys vs actual user journeys.

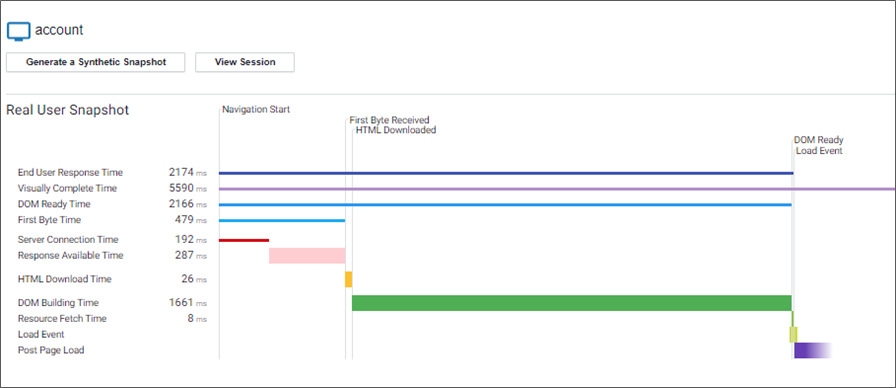
AppDynamics RUM captures detailed diagnostic information to help triage issues, including:
- Single Page Application performance
- Page Component load details,
- AJAX requests,
- Detailed Error Snapshots
- Dynamic Business Transaction Baselining (Normal vs Slow Performance)
- User browser version and device type,
- Geographic location of users,
- Connection method (e.g. browser vs mobile), and device type.

AppDynamics RUM can also provide direct correlation to AppDynamics APM agents to combine the ‘front-end’ and ‘back-end’ of these user sessions where Salesforce may traverse additional down-stream applications and infrastructure.
Why JDS?
As experts in Application Performance Management (APM) and Observability, JDS have extensive experience in helping our customers determine the root cause of performance issues.
Contact us at [email protected] to discuss how monitoring Salesforce can be used to understand your end users and make informed decisions with quantifiable metrics.

