Recently, one of JDS’ clients reached out for assistance, as they were experiencing inconsistent website performance. They had just moved to a new platform, and were receiving alerts about unexpectedly slow response times, as well as intermittent logon errors. They were concerned that, were the reports accurate, this would have an adverse impact on customer retention, and potentially reduce their ability to attract new customers. When manual verification couldn’t reproduce the issues, they called in one of JDS’ sleuths to try to locate and fix the problem—if one existed at all.
The Plot Thickens
The client’s existing active robot monitoring solution using the HPE Business Process Monitor (BPM) suite showed that there were sporadic difficulties in loading pages on the new platform and in logging in, but the client was unable to replicate the issue manually. If there was an issue, where exactly did it lie?
Commencing the Investigation
The client had deployed Splunk and it was ingesting logs from the application in question—but its features were not being utilised to investigate the issue.
JDS consultant Danesen Narayanen entered the fray and was able to use Splunk to analyse the data received. He could therefore immediately understand the issue the client was experiencing. He confirmed that the existing monitoring solution was reporting the problem accurately, and that the issue had not been affecting the client’s website prior to the re-platform
Using the data collected by HPE BPM as a starting point, Danesen was able to drill down and compare what was happening with the current system on the new platform to what had been happening on the old one. He quickly made several discoveries:
1. There appeared to be some kind of server error.
Since the re-platform, there had been a spike in a particular server error. Our JDS consultant reviewed data from the previous year, to see whether the error had happened before. He noted that there had previously been similar issues, and validated them against BPM to determine that the past errors had not had a pronounced effect on BPM—the spike in server errors seemed to be a symptom, rather than a cause.


2. There seemed to be an issue with user-end response time.
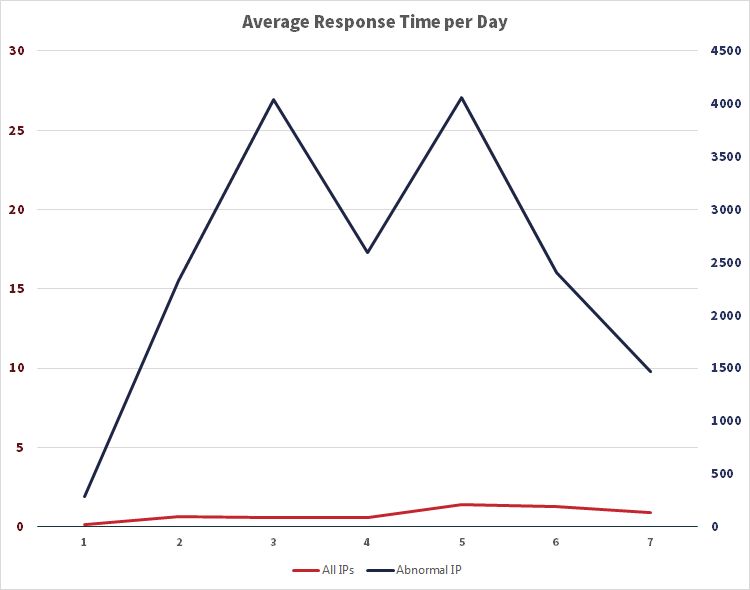
Next, our consultant used Splunk to look at the response time by IP addresses over time, to see if there was a particular location being affected—was the problem at server end, or user end? He identified one particular IP address which had a very high response time. What’s more, this was a public IP address, rather than one internal to the client. It seemed like there was a end-user problem—but what was the IP address that was causing BPM to report an issue?

Tracking Down the Mystery IP Address
At this point our consultant called for the assistance of another JDS staff member, to track down who owned the problematic IP address. As it turned out, the IP address was owned by the client, and was being used by a security tool running vulnerability checks on the website. After the re-platform, the tool had gone rogue: rather than running for half an hour after the re-platform, it continued to open a number of new web sessions throughout the day for several days.
The Resolution
Now that the culprit had been identified, the team were quickly able to log in to the security tool to turn it off, and the problem disappeared. Performance and availability times returned to what they should be, BPM was no longer reporting issues, and the client’s website was running smoothly once more. Thanks to the combination of Splunk’s power, HPE's active monitoring tools, and JDS’ analytical and diagnostic experience, resolution was achieved in under a day.
