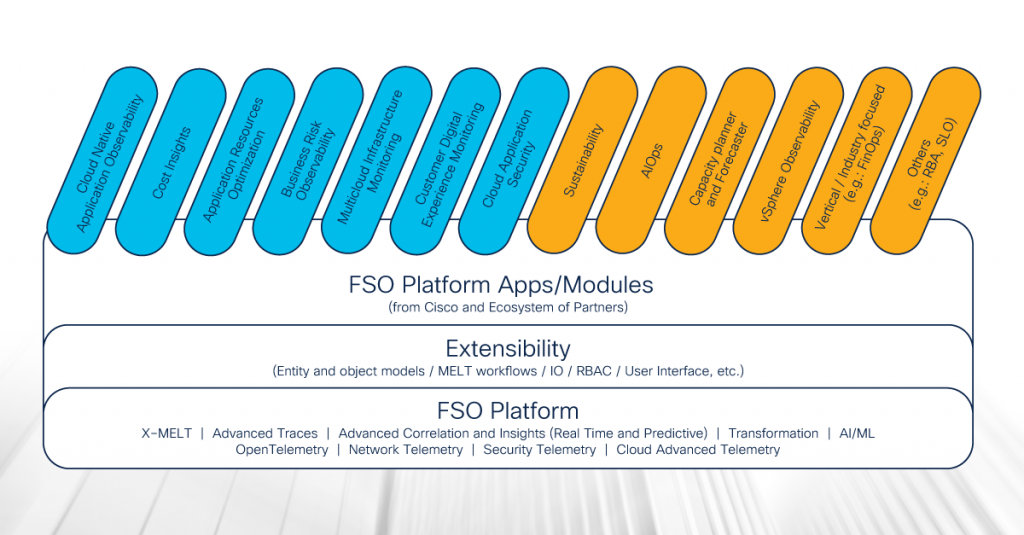
Full stack observability (FSO) is of paramount importance in today’s digital landscape due to the complexity of applications and infrastructure. Modern business systems can involve distributed architectures, microservices, and containers, necessitating a holistic view to properly understand how all components interact. The rise of cloud-native environments and DevOps practices also underscores the need for full stack observability to support resource optimisation, collaboration, and continuous delivery.
The New Relic FSO Dashboard offers a powerful and customisable platform that empowers developers and operations teams with real-time insights and comprehensive data visualisation.
So what does the New Relic FSO dashboard actually look like?

The ‘Business Overview’ dashboard displays important business metrics such as Average Order values By Day, Purchase Volume, Revenue Trend, Sales Funnel, and Abandoned Cart Rate.

In the second tab, the IT Platform Overview dashboard provides detailed information about application and infrastructure performance and status, including availability, daily site visitors, slow pages, most-used features, and mobile device types accessing the platform. This allows for quick identification of issues and prompt corrective actions.

The third tab, Cloud Migration Dashboard, helps track the progress of the migration journey and provides insights into how the cloud environment is being executed. The Percent of On-premises Hosts vs AWS Hosts, Average CPU Usage by AWS vs On-premises Host Location, Total Number of Hosts by Application, and Average Response Time by Host Location are displayed to show the before and after application/host response times, allowing you to determine the extent of improvement in response time after migration. This dashboard enables developers and IT operations teams to monitor the progress of migration in real time.

The User Metrics Dashboard provides an overall view of user behaviour to optimise applications and enhance user experience. It includes metrics such as visitor count, app usage, page visits, average response time, page loading time, and visitor countries/cities.

The Data Analytics Dashboard helps track database performance, identify and resolve performance issues, and the Application Metrics Dashboard provides real-time information on application performance, including response time, error rate, and throughput, allowing for proactive optimisation.

Additionally, there is a dashboard that helps manage AWS costs. Many companies experience difficulties in cost management when migrating to the cloud. In the AWS Budget Overview dashboard, you can examine the total cost divided into actual costs, forecasted costs, and limits. You can also view important metrics such as Pre-production Budget, Total Cost Trends, Budget Trending, and Estimated changes per service. This allows you to track cloud costs in real time and quickly identify areas that require cost optimisation. Furthermore, it provides valuable assistance in planning future budgeting related to the cloud environment.
As a trusted, Gold partner of New Relic, JDS has a team of experts who can not only implement the New Relic FSO dashboard, but also elevate your dashboard experience, take it to the next level, and unleash its full potential. From designing visually appealing layouts, to fine-tuning performance metrics and alerts, JDS can maximise the value of New Relic’s powerful observability platform. Your applications and users will thank you for it!

