Tag: monitoring

Understanding your Customer Journeys in Salesforce with AppDynamics

The Problem

JDS Australia works with numerous customers who utilise the force.com platform as the primary interface for their end users (internal and external) to execute business critical services. The flexibility and extensibility of the component based Lightning framework has allowed businesses to customise the platform to meet their specific requirements.

However, many of these companies struggle to monitor, quantify or pinpoint the impact of performance in the Salesforce platform to their end users and ultimately their business. Furthermore, there is limited capability to provide detailed Salesforce information for root cause analysis (e.g. is the problem with a particular lightning component(s) vs core Salesforce platform vs multiple pages?).

The Solution

Using AppDynamics Real User Browser Monitoring (RUM) coupled with advanced JavaScript configuration, we have created a solution.

Unlike traditional methods involving logfile or API based monitoring; real user monitoring collects rich metrics from the end users’ perspective. JDS has also further integrated  additional custom code to identify AJAX requests and inject page names into the stream and provide business context and make sense of the data.
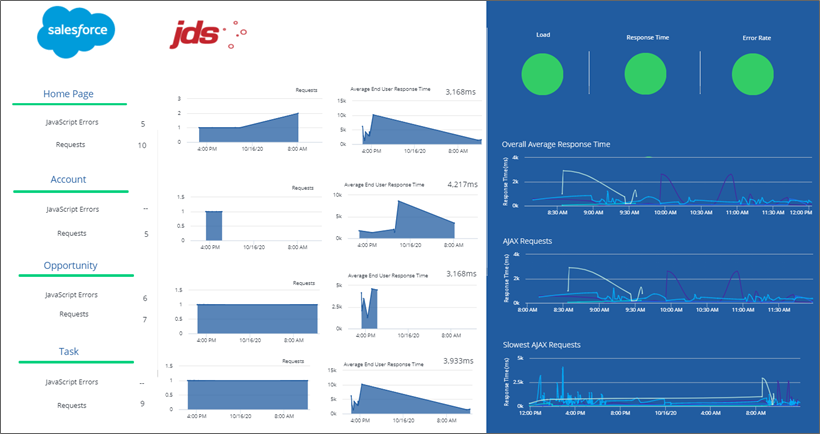
Dashboards provide Salesforce Performance at a glance

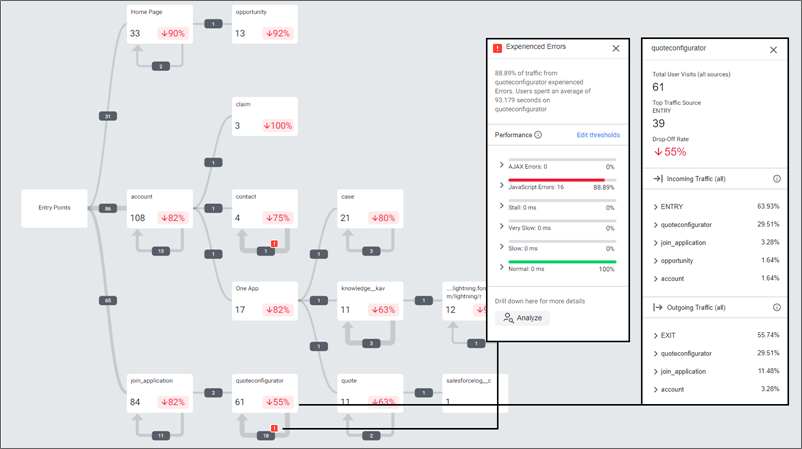
Additionally, AppDynamics RUM is able to identify and dynamically visualise each step of Customer Journeys as they traverse Salesforce, in near real time. 

Using the collated metrics these businesses have been able to proactively alert support teams of issues, and also utilise the historic data to analyse customer behaviour to understand how customers are using the platform. For example, expected user journeys vs actual user journeys.
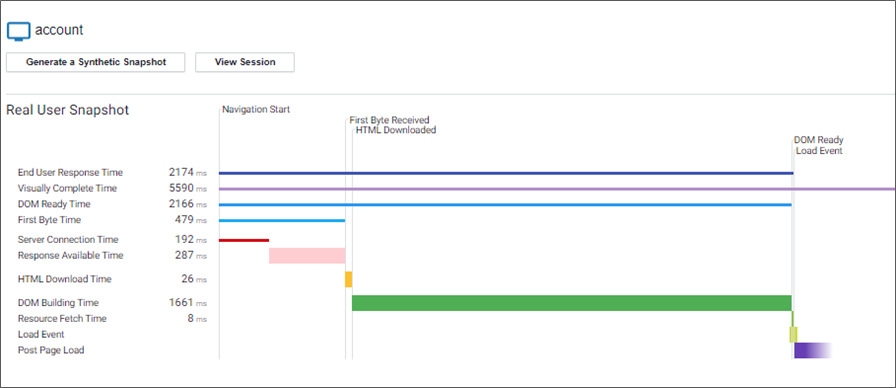
AppDynamics RUM captures detailed diagnostic information to help triage issues, including:

  • Single Page Application performance
  • Page Component load details, 
  • AJAX requests, 
  • Detailed Error Snapshots
  • Dynamic Business Transaction Baselining (Normal vs Slow Performance)
  • User browser version and device type,
  • Geographic location of users,
  • Connection method (e.g. browser vs mobile), and device type. 
AppDynamics RUM can also provide direct correlation to AppDynamics APM agents to combine the ‘front-end’ and ‘back-end’ of these user sessions where Salesforce may traverse additional down-stream applications and infrastructure.

Why JDS?

As experts in Application Performance Management (APM) and Observability, JDS have extensive experience in helping our customers determine the root cause of performance issues.

Contact us at [email protected] to discuss how monitoring Salesforce can be used to understand your end users and make informed decisions with quantifiable metrics. 

Monitoring Atlassian Suite with AppDynamics

Millions of IT professionals use JIRA, Confluence, and Bitbucket daily as the backbone of their software lifecycle. These tools are critical to getting anything done in thousands of organisations. If you’re reading this, it’s safe to guess that’s the case for your organisation too!

Application monitoring is crucial when your business relies on good application performance. Just knowing that your application is running isn’t enough; you need assurance that it’s performing optimally. This is what a JDS client that runs in-house instances of JIRA, Confluence, and Bitbucket, recently found out.

This client, a major Australian bank, started to notice slowness with JIRA, but the standard infrastructure monitoring they were using was not providing enough insight to allow them to determine the root cause.

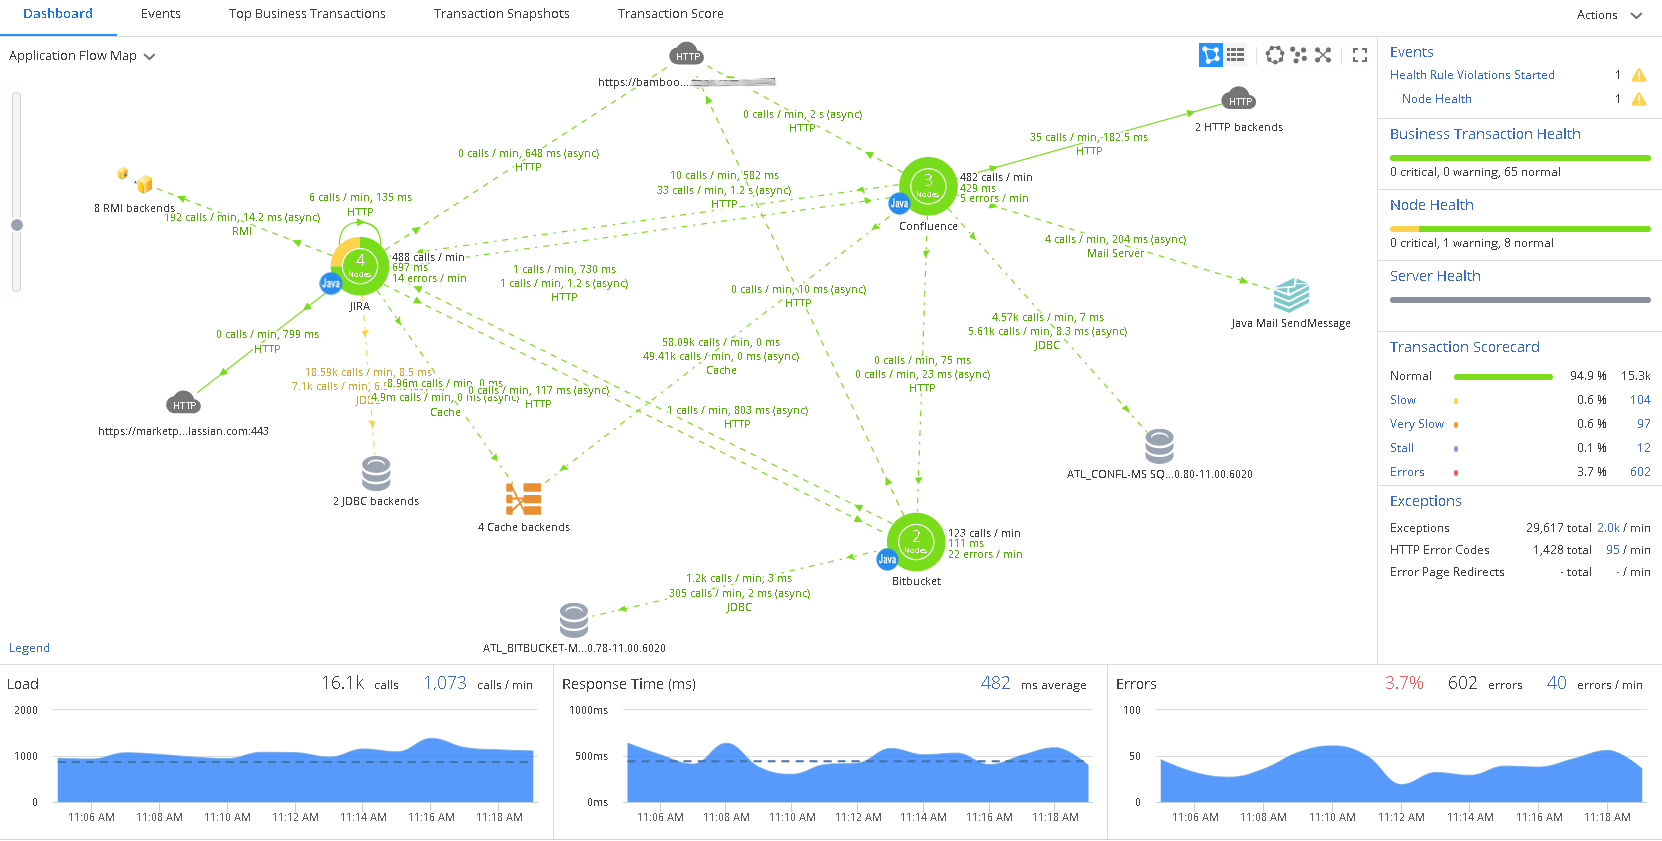
JDS was able to instrument their Atlassian products with AppDynamics APM agents to gain insights into the performance of the applications. After deployment of the Java Agents to the applications, AppDynamics automatically populated the topology map below, known as a Flow Map. This Flow Map shows the interactions for each application, accompanied by overall application and Business Transaction health, and metrics like load, response time, and errors.

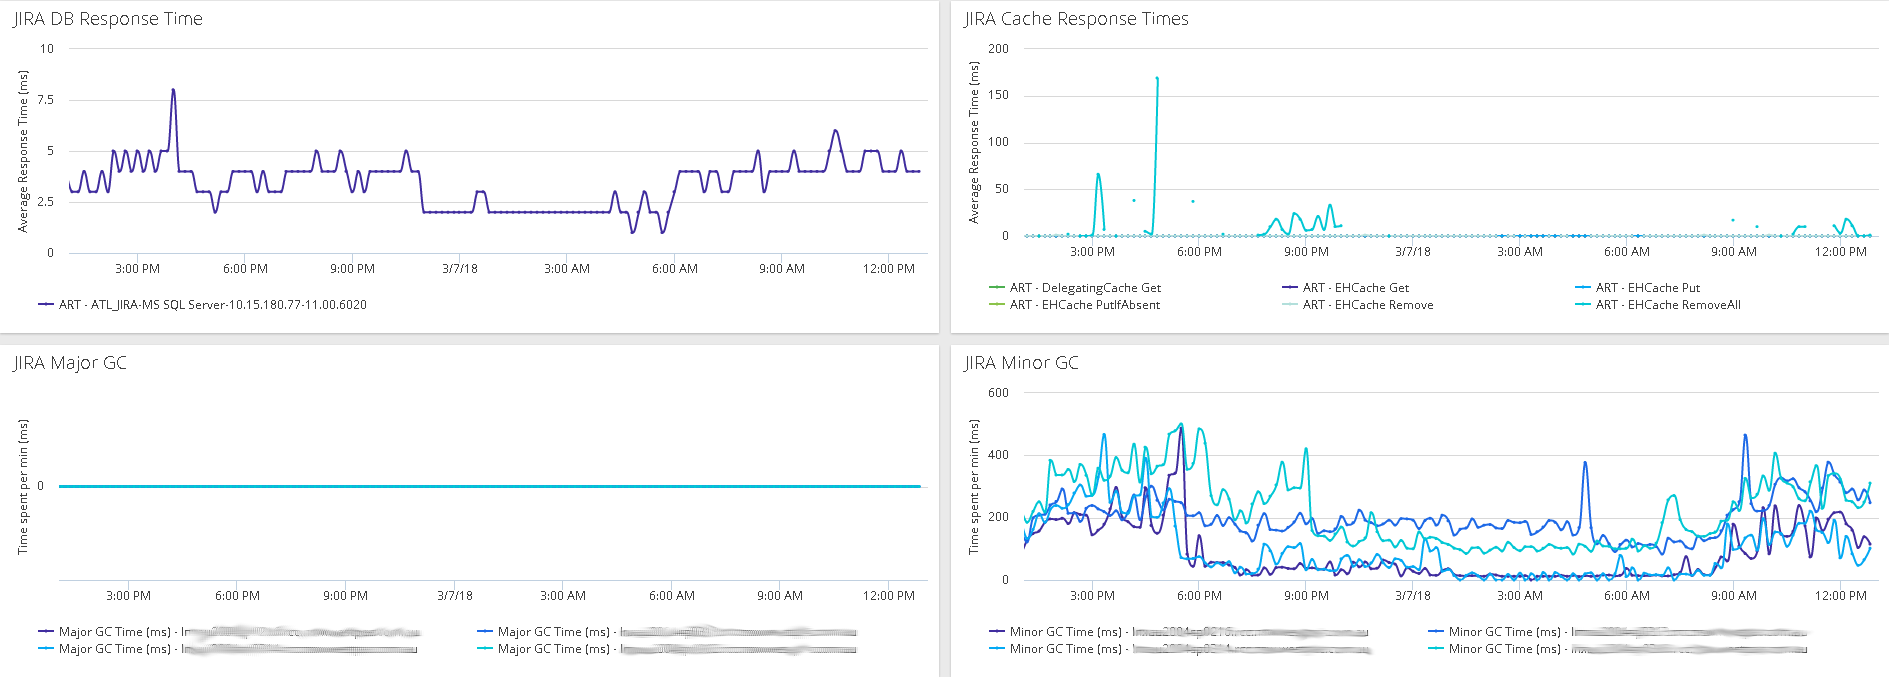
After some investigation, we found the root cause of the JIRA slowness was some Memcached backends. Once we determined the root cause and resolved the issue, operational dashboards were created to help the Operations team monitor the Atlassian application suite. Below is a screenshot of a subsection of the dashboard showing Database Response Times, Cache Response Times, and Garbage Collection information.

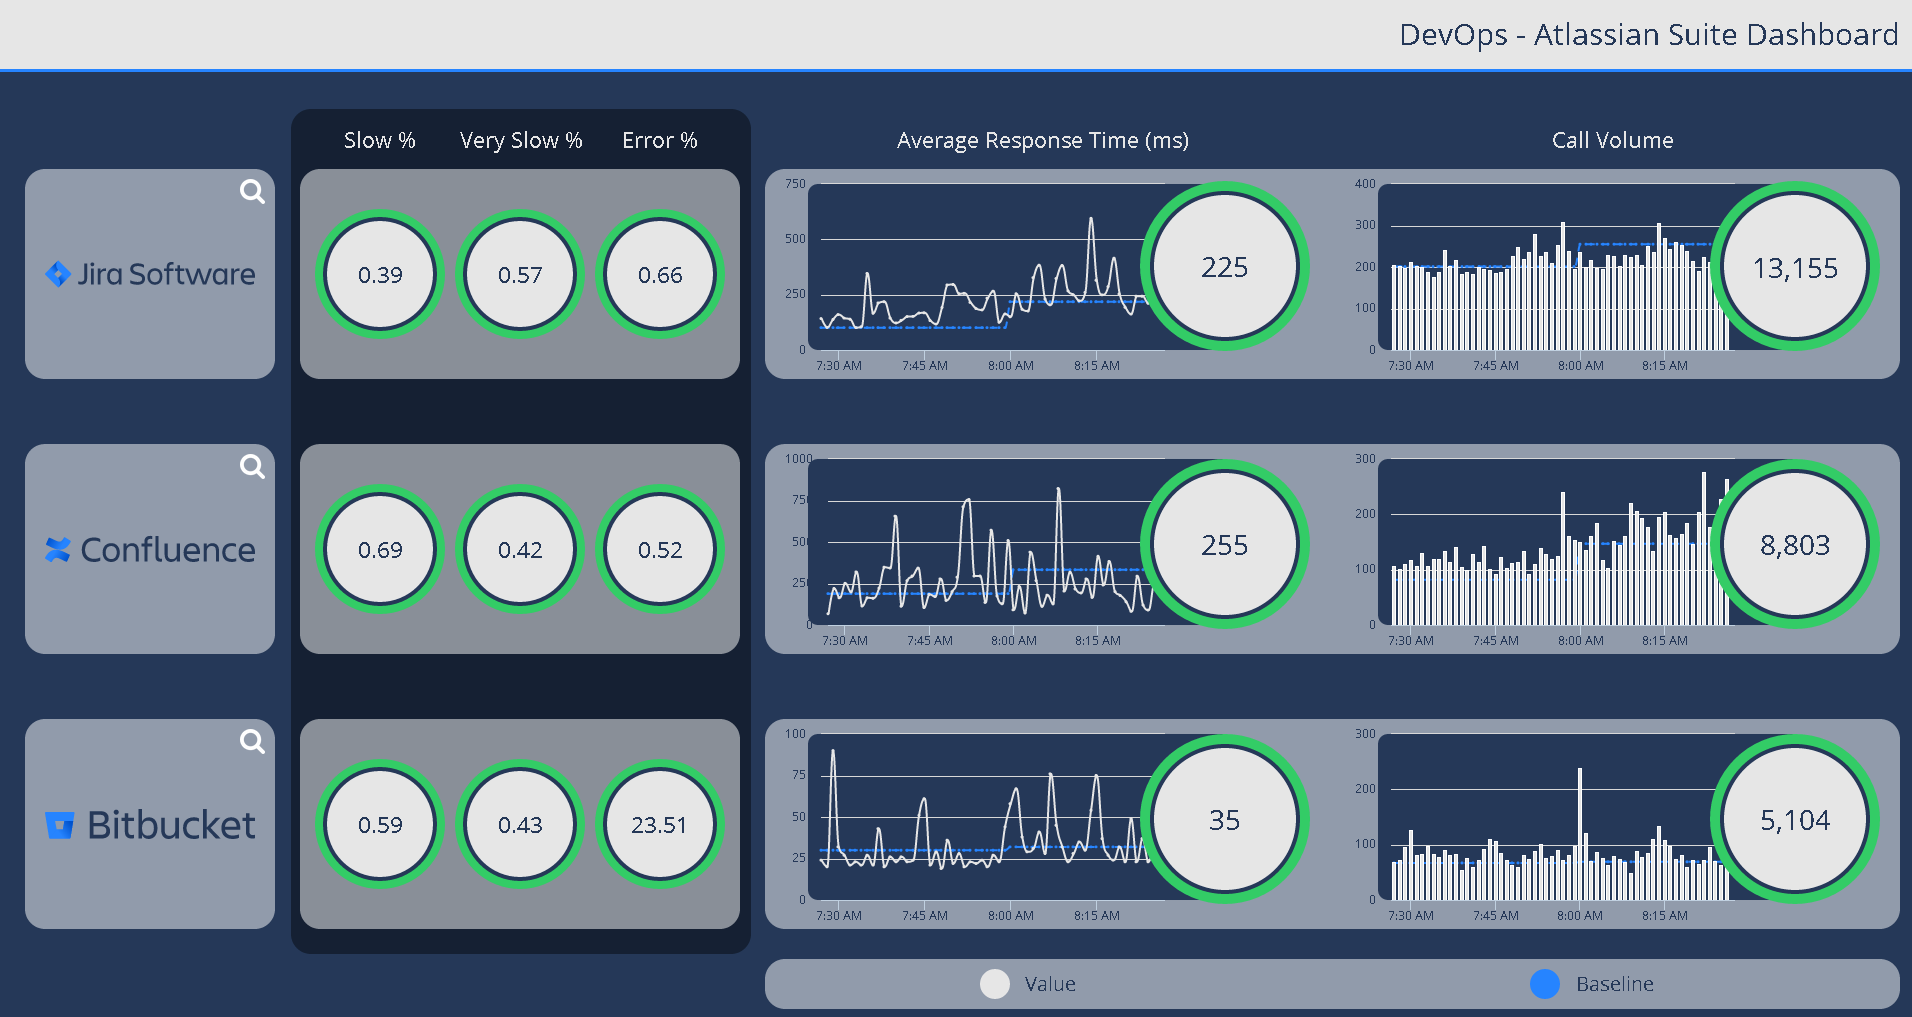
An overview dashboard was also created to assist with monitoring across the suite. The Dashboard has been split out to show Slow, Very Slow, and Error percentages along with Average Response Times and Call Volumes for each application. Drilldowns were also added to take the user directly to the respective application Flow Map. Using these dashboards, they can, at a glance, check the overall application health for the Atlassian products. This has helped them improve the quality of service and user experience.

The bank’s JIRA users now suffer from far fewer slowdowns, particularly during morning peaks when many hurried story updates are taking place in time for stand-ups! The DevOps team is also able to get a heads-up from AppDynamics when slowness starts to occur, rather than when performance has fallen off a cliff.

So if you’re looking for more effective ways to monitor your Atlassian products, give our AppDynamics team a call. We can develop and implement a customised solution for your business to help ensure your applications run smoothly and at peak performance.

Our team on the case

Our AppDynamics stories

The Splunk Gardener

The Splunk wizards at JDS are a talented bunch, dedicated to finding solutions—including in unexpected places. So when Sydney-based consultant Michael Clayfield suffered the tragedy of some dead plants in his garden, he did what our team do best: ensure it works (or ‘lives’, in this case). Using Splunk’s flexible yet powerful capabilities, he implemented monitoring, automation, and custom reporting on his herb garden, to ensure that tragedy didn’t strike twice.

My herb garden consists of three roughly 30cm x 40cm pots, each containing a single plant—rosemary, basil, and chilli. The garden is located outside our upstairs window and receives mostly full sunlight. While that’s good for the plants, it makes it harder to keep them properly watered, particularly during the summer months. After losing my basil and chilli bush over Christmas break, I decided to automate the watering of my three pots, to minimise the chance of losing any more plants. So I went away and designed an auto-watering setup, using soil moisture sensors, relays, pumps, and an Arduino—an open-source electronic platform—to tie it all together.

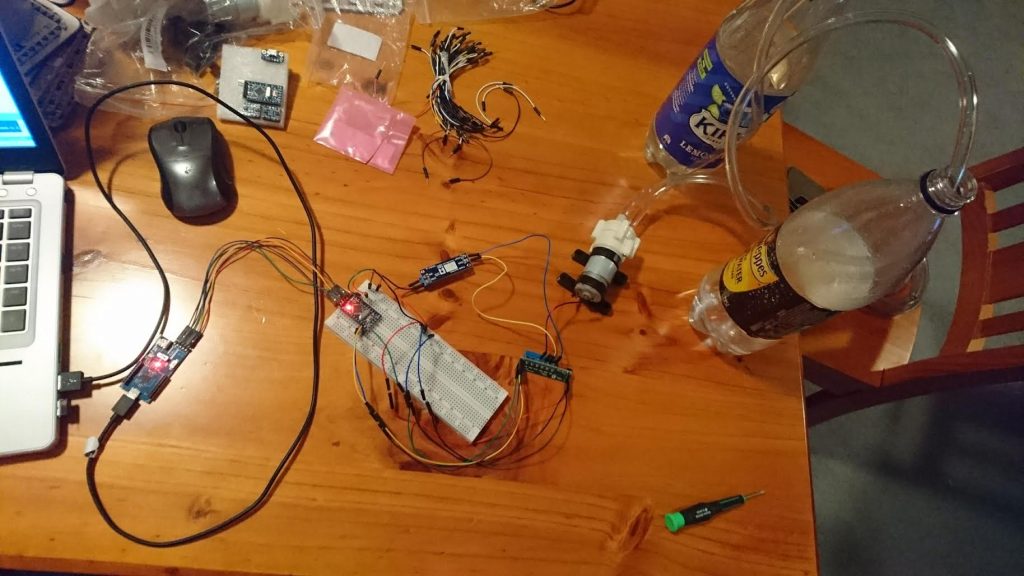
Testing the setup by transferring water from one bottle to another.

I placed soil moisture sensors in the basil and the chilli pots—given how hardy the rosemary was, I figured I could just hook it up to be watered whenever the basil in the pot next to it was watered. I connected the pumps to the relays, and rigged up some hosing to connect the pumps with their water source (a 10L container) and the pots. When the moisture level of a pot got below a certain level, the Arduino would turn the equivalent pump on and water it for a few seconds. This setup worked well—the plants were still alive—except that I had no visibility over what was going on. All I could see was that the water level in the tank was decreasing. It was essential that the tank always had water in it, otherwise I'd ruin my pumps by pumping air.

To address this problem, I added a float switch to the tank, as I was aiming to set it up so I could stop pumping air if I forgot to fill up the tank. Using a WiFi adapter, I connected the Arduino to my home WiFi. Now that the Arduino was connected to the internet, I figured I should send the data into Splunk. That way I'd be able to set up an alert notifying me when the tank’s water level was low. I'd also be able to track each plant’s moisture levels.

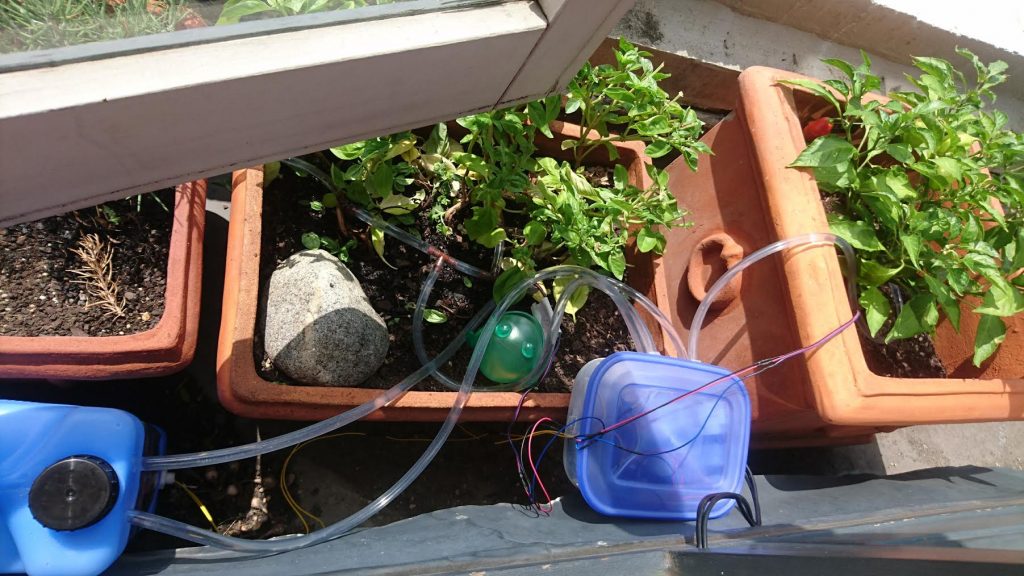
The setup deployed: the water tank is on the left; the yellow cables coming from the tank are for the float switch; and the plastic container houses the pumps and the Arduino, with the red/blue/black wires going to the sensors planted in the soil of the middle (basil) and right (chilli) pots. Power is supplied via the two black cables, which venture back inside the house to a phone charger.

Using the Arduino’s Wifi library, it’s easy to send data to a TCP port. This means that all I needed to do to start collecting data in Splunk was to set up a TCP data input. Pretty quickly I had sensor data from both my chilli and basil plants, along with the tank’s water status. Given how simple it was, I decided to add a few other sensors to the Arduino: temperature, humidity, and light level. With all this information nicely ingested into Splunk, I went about creating a dashboard to display the health of my now over-engineered garden.

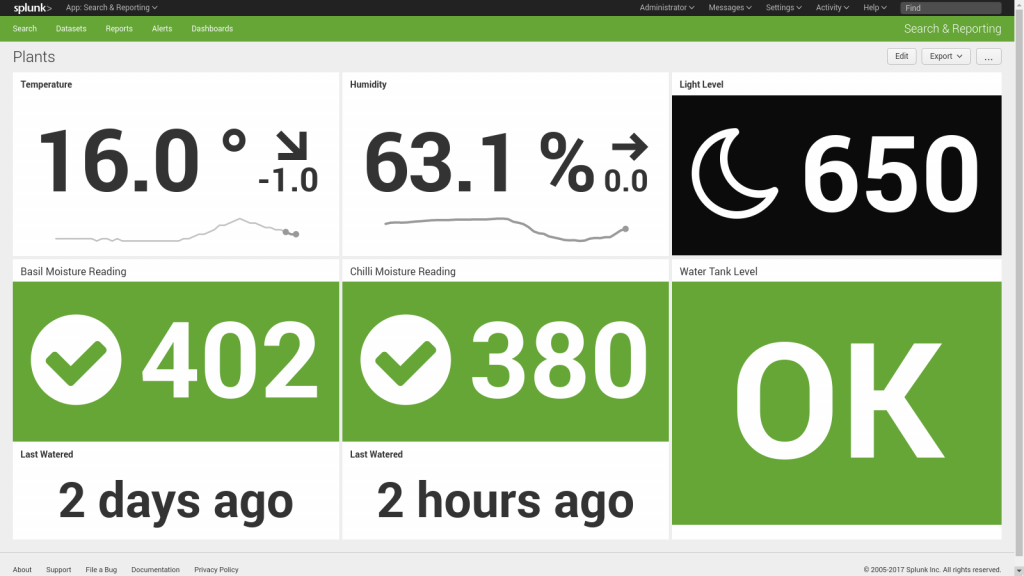
The overview dashboard for my garden. The top left and centre show current temperature and humidity, including trend, while the top right shows the current light reading. The bottom left and centre show current moisture reading and the last time each plant was watered. The final panel in the bottom right gives the status of the tank's water level.

With this data coming in, I was able to easily understand what was going on with my plants:

  1. I can easily see the effect watering has on my plants, via the moisture levels (lower numbers = more moisture). I generally aim to maintain the moisture level between 300 and 410. Over 410 and the soil starts getting quite dry, while putting the moisture probe in a glass of water reads 220—so it’s probably best to keep it well above that.
  2. My basil was much thirstier than my chilli bush, requiring about 50–75% more water.
  3. It can get quite hot in the sun on our windowsill. One fortnight in February recorded nine 37+ degree days, with the temperature hitting 47 degrees twice during that period.
  4. During the height of summer, the tank typically holds 7–10 days’ worth of water.

Having this data in Splunk also alerts me to when the system isn't working properly. On one occasion in February, I noticed that my dashboard was consistently displaying that the basil pot had been watered within the last 15 minutes. After a few minutes looking at the data, I was able to figure out what was going on.

Using the above graph from my garden’s Splunk dashboard, I could see that my setup had correctly identified that the basil pot needed to be watered and had watered it—but I wasn't seeing the expected change in the basil’s moisture level. So the next time the system checked the moisture level, it saw that the plant needed to be watered, watered it again, and the cycle continued. When I physically checked the system, I could see that the Arduino was correctly setting the relay and turning the pump on, but no water was flowing. After further investigation, I discovered that the pump had died. Once I had replaced the faulty pump, everything returned to normal.

Since my initial design, I have upgraded the system a few times. It now joins a number of other Arduinos I have around the house, sending data via cheap radio transmitters to a central Arduino that then forwards the data on to Splunk. Aside from the pump dying, the garden system has been functioning well for the past six months, providing me with data that I will use to continue making the system a bit smarter about how and when it waters my plants.

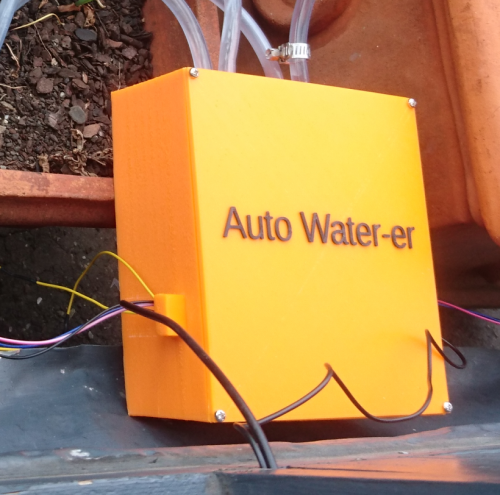
I've also 3D printed a nice case in UV-resistant plastic, so my gardening system no longer has to live in an old lunchbox.

Our team on the case