Category: Splunk

Get more from your SAP data with PowerConnect

SAP PowerConnect for Splunk is the only SAP-certified SAP to Splunk connector, “powered by SAP NetWeaver.” This solution runs inside SAP and extracts machine data, security events, and logs from SAP and ingests the information into Splunk in real time. As an SAP partner and the sole Australian implementation partner for SAP PowerConnect for Splunk, JDS Australia can help you see what’s happening inside your SAP system, proactively report on trends, alert on incidents, and even enable you to predict what will happen in the future.

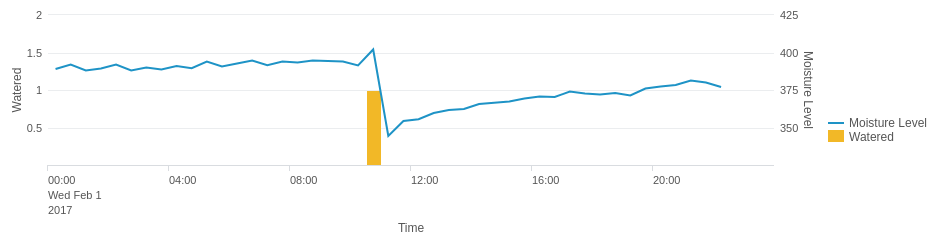
This screen shows standard performance metrics from within SAP:

SAP Data PowerConnect

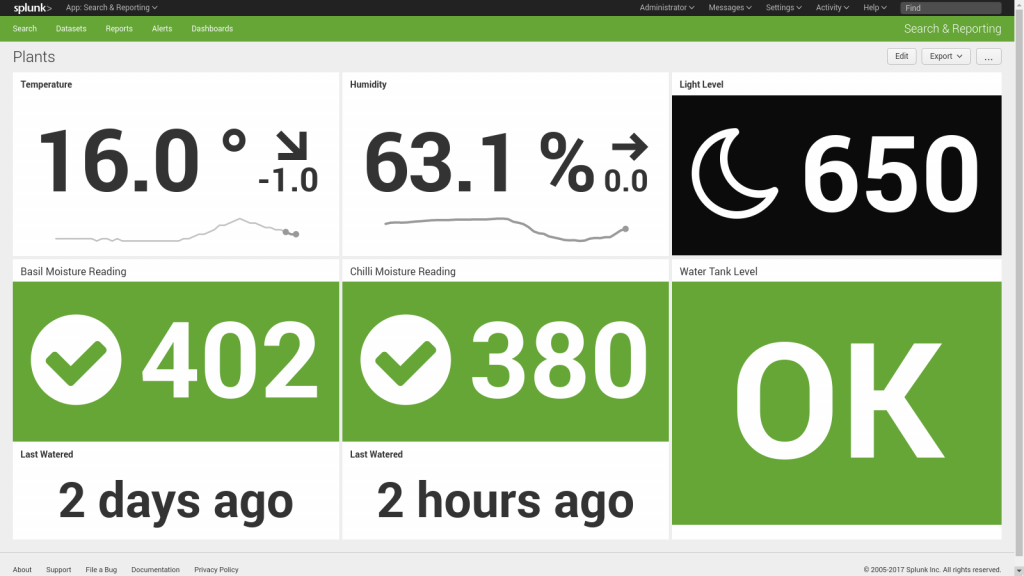
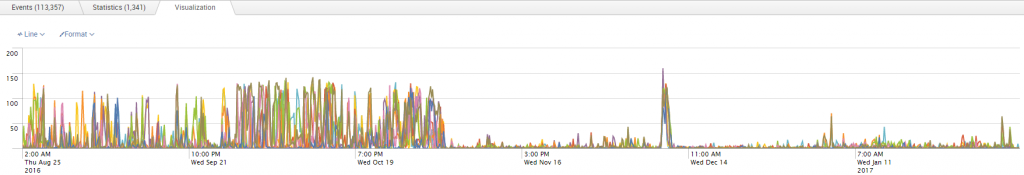
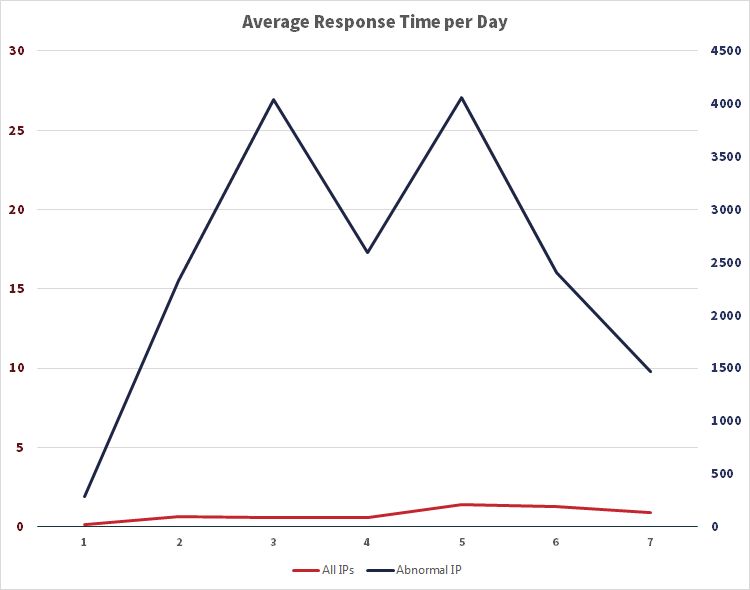
SAP PowerConnect for Splunk converts this tabular data and presents it on a highly visual dashboard:

PowerConnect for Splunk

Find out more about SAP PowerConnect for Splunk and how it can be a key enabler for your business in 2018 by attending our event, “Splunkify your SAP data with PowerConnect.” JDS and Splunk are co-hosting events in Sydney and Melbourne in May 2018. Light canapés and beverages will be served. Choose the most convenient location for you and register below. We look forward to seeing you there.

What is AIOps?

Gartner has coined another buzz word to describe the next evolution of ITOM solutions. AIOps uses the power of Machine Learning and big data to provide pattern discovery and predictive analysis for IT Ops.

What is the need for AIOps?

Organisations undergoing digital transformation are facing a lot of challenges that they wouldn’t have faced even ten years ago. Digital transformation represents a change in organisation structure, processes, and abilities, all driven by technology. As technology changes, organisations need to change with it.

This change comes with challenges. The old ITOps solutions now need to manage micro services, public and private APIs, and Internet-of-Things devices.

As consumers, IT managers are used to personalised movie recommendations from Netflix, or preemptive traffic warnings from Google. However, their IT management systems typically lack this sort of smarts—reverting to traffic light dashboards.

There is an opportunity in the market to combine big data and machine learning with IT operations.

Gartner has coined this concept AIOps: Artificial Intelligence for IT Ops.

AIOps platforms utilize big data, modern machine learning and other advanced analytics technologies to directly and indirectly enhance IT operations (monitoring, automation and service desk) functions with proactive, personal and dynamic insight. AIOps platforms enable the concurrent use of multiple data sources, data collection methods, analytical (real-time and deep) technologies, and presentation technologies.” – Colin Fletcher, Gartner

AIOps 1

Current State – Gartner Report

Gartner coined the term AIOps in 2016, although they originally called it Algorithmic IT Operations. They don’t yet produce a magic quadrant for AIOps, but that is likely coming.

Gartner has produced a report which summarises both what AIOps is hoping to solve, and which vendors are providing solutions.

Eleven core capabilities are identified, with only four vendors able to do all 11: HPE, IBM, ITRS, and Moogsoft.

How does Splunk do AIOps?

Splunk is well positioned to be a leader in the AIOps field. Their AIOps solution is outlined on their website. Splunk AIOps relies heavily on the Machine Learning Toolkit, which provides Splunk with about 30 different machine learning algorithms.

Splunk provides an enterprise machine learning and big data platform which will help AIOps managers:

  • Get answers and insights for everyone: Through the Splunk Query Language, users can predict past, present, and future patterns of IT systems and service performance.
  • Find and solve problems faster: Detect patterns to identify indicators of incidents and reduce irrelevant alerts.
  • Automate incident response and resolution: Splunk can automate manual tasks, which are triggered based on predictive analytics.
  • Predict future outcomes: Forecast on IT costs and learn from historical analysis. Better predict points of failure to proactively improve the operational environment.
  • Continually learn to take more informed decisions: Detect outliers, adapt thresholds, alert on anomalous patterns, and improve learning over time.

Current offerings like ITSI and Enterprise Security also implement machine learning, which take advantage of anomaly detection and predictive algorithms.

As the complexity in IT systems increases, so too will the need to analyse and interpret the large amount of data generated. Humans have been doing a good job to date, but there will come a point where the complexity will be too great. Organisations which can complement their IT Ops with machine learning will have a strategic advantage over those who rely on people alone.

Conclusion

How synthetic monitoring will improve application performance for a large bank

JDS is currently working with several businesses across Australia to implement our custom synthetic monitoring solution, Active Robot Monitoring—powered by Splunk. ARM is a simple and effective way of maintaining the highest quality customer experience with minimal cost. While other synthetic monitoring solutions operate on price-per-transaction model, ARM allows you to conduct as many transactions as you want using under the umbrella of your Splunk investment. We recently developed a Splunk ARM solution for one of the largest banks in Australia and are in the process of implementing it. Find out more about the problem presented, our proposed solution, and the expected results below.


The problem

A large Australian bank (‘the Bank’) needs to properly monitor the end-to-end activity of its core systems/applications. This is to ensure that the applications are available and performing as expected at all times. Downtime or poor performance, even for only a few minutes, could potentially result in great loss of revenue and reputation damage. While unscheduled downtime or performance degradation will inevitably occur at some point, the Bank wants to be notified immediately of any performance issues. They also want to identify the root cause of the problem easily, resolve the issue, and restore expected performance and availability as quickly as possible. To achieve this, the Bank approached JDS for a solution to monitor, help triage, and highlight error conditions and abnormal performance.

The solution

JDS proposed implementing the JDS Active Robot Monitoring (ARM) Splunk application. ARM is a JDS-developed Splunk application which utilises scripts written in a variety of languages (e.g. Selenium) with custom built Splunk dashboards. In this case, Selenium is used to emulate actual users interacting with the web application. These interactions or transactions will be used to determine if the application is available, whether a critical function of the application is working properly, and what the performance of the application is like. All that information will be recorded in Splunk and used for analysis.

Availability and performance metrics will be displayed in dashboards, which fulfils several purposes—namely providing management with a summary view of the status of applications and support personnel with more information to help identify the root cause of the problem efficiently. In this case, Selenium was chosen as it provides for complete customisations not available in other similar offerings in the synthetic monitoring segment, and when coupled with Splunk’s analytical and presentation capability, provides the best solution to address the Bank’s problem.

The expected results

With the implementation of the JDS ARM application at the Bank, availability, and performance of their core applications is expected to improve and remain at a higher standard. Downtime, if it occurs, will be quickly rectified as support personnel will be alerted immediately and have access to all the vital data required to do a root cause analysis of the problem quickly. Management will have a better understanding of the health of the application and will be able to assign valuable resources more effectively to work on it.

What can ARM do for your business?

Throughout the month of November 2017, JDS is open to registrations for a free on-site workshop at your business. We will discuss Active Robot Monitoring and how it could benefit your organisation specifically. To register for this exclusive opportunity,  please enter your information below and one of our account executives will contact you to set up a time to meet at your location.

Event: What can Splunk do for you?

Registration Form

By clicking this button, you submit your information to JDS Australia, who will use it to communicate with you about this event and their other services.

Event Details

Splunk .conf2017 was one of the biggest events of the year, with thousands gathering in Washington D.C. to experience the latest Splunk has to offer. One of JDS' senior consultants and Splunk experts, Michael Clayfield, delivered two exceptional presentations highlighting specific Splunk capabilities and how JDS can work with businesses to make them happen.

We don't want our Australian clients to miss out on hearing these exciting presentations, which is why we are pleased to invite you to our .conf17 recap event in Melbourne. You'll get to hear both presentations, and will also have a chance to chat with account executives and discuss Splunk solutions for your business.

The presentations will cover:

  • Using Active Robot Monitoring with Splunk to Improve Application Performance
  • Running Splunk within Docker

When: Thursday 23 November, 5-8pm 
Where:
Splunk Melbourne Office, Level 16, North Tower, 525 Collins Street

Case Study: Netwealth bolster their security with Splunk

The prompt and decision

"As a financial services organisation, information security and system availability are core to the success of our business. With the business growing, we needed a solution that was scalable and which allowed our team to focus on high-value management tasks rather than on data collection and review."

Information security is vital to modern organisations, and particularly for those that deal in sensitive data, such as Netwealth. It is essential to actively assess software applications for security weaknesses to prevent exploitation and access by third parties, who could otherwise extract confidential and proprietary information. Security monitoring looks for abnormal behaviours and trends that could indicate a security breach.

"The continued growth of the business and the increased sophistication of threats prompted us to look for a better way to bring together our security and IT operations information and events," explains Chris Foong, Technology Infrastructure Manager at Netwealth. "Advancements in the technology available in this space over the last few years meant that a number of attractive options were available."

The first stage in Netwealth’s project was to select the right tool for the job, with several options short-listed. Each of these options was pilot tested, to establish which was the best fit to the requirements—and Splunk, with its high versatility and ease of use, was the selected solution.

The power in the solution comes from Splunk’s ability to combine multiple real-time data flows with machine learning and analysis which prioritises threats and actions, and the use of dynamic visual correlations and on-demand custom queries to more easily triage threats. Together, this empowers IT to make informed decisions.

Objective

Netwealth’s business objective was to implement a security information and event management (‘SIEM’) compliant tool to enhance management of security vulnerabilities and reporting. Their existing tool no longer met the expanding needs of the business, and so they looked to Splunk and JDS to provide a solution.

Approach

Netwealth conducted a proof of concept with various tools, and Splunk was selected. JDS Australia, as Splunk Implementation Partner, provided licensing and expertise.

IT improvements

Implementing Splunk monitoring gave Netwealth enhanced visibility over their security environment, and the movement of sensitive data through the business. This enabled them to triage security events and vulnerabilities in real time.

About Netwealth

Founded in 1999, Netwealth was established to provide astute investors and wealth professionals with a better way to invest, protect and manage their current and future wealth. As a business, Netwealth seeks to enable, educate and inspire Australians to see wealth differently and to discover a brighter future.

Netwealth offers a range of innovative portfolio administration, superannuation, retirement, investment, and managed account solutions to investors and non-institutional intermediaries including financial advisers, private clients, and high net worth firms.

Industry

Financial Services

Primary applications

  • Office365
  • Fortigate
  • IIS
  • Juniper SRX
  • Microsoft DNS
  • Microsoft AD and ADFS (Active Directory Federation Services)
  • JBoss (Java EE Application Server)
  • Fortinet

Primary software

  • Splunk Enterprise
  • Splunk Enterprise Security (application add-on)

The process

Now that Splunk had been identified as the best tool for the job, it was time to find an Implementation Partner—and that’s where JDS came in. JDS, as the most-certified Australian Splunk partner, was the natural choice. "JDS provided Splunk licensing, expertise on integrating data sources, and knowledge transfer to our internal team," says Foong.  

An agile, project managed approach was taken.  

  1. Understand the business requirements and potential threats associated with Netwealth’s environment.
  2. Identify the various services that required security monitoring.
  3. Identify the data feed for those services.
  4. Deploy and configure core Splunk.
  5. Deploy the Enterprise Security application onto Splunk.
  6. Configure the Enterprise Security application to enable features. These features gave visibility into areas of particular concern.

The JDS difference

For this project, JDS "assisted Netwealth in deploying and configuring Splunk, and gaining confidence in Splunk Enterprise Security," explains the JDS Consultant on the case. "We were engaged as a trusted partner with Splunk, and within hours of deployment, we had helped Netwealth to gain greater visibility of the environment."

JDS were able to leverage their Splunk expertise to give added value to the client, advising them on how to gain maximum value in terms of both project staging, and in the onboarding of new applications. "We advocated a services approach—start by designing the dashboard you want, and work backwards towards the data required to build that dashboard."

"The JDS team worked well with our team, were knowledgeable about the product, and happy to share that knowledge with our team," says Netwealth’s Chris Foong. "They delivered what they said they would, and didn’t under- or over-sell themselves. We would work with them again."

End results

Chris Foong says that Netwealth was looking for "improved visibility over security and IT operations information and events, to aid in faster response and recovery"—and the project was a success on all counts.

"The project was delivered on time and to budget, and Splunk is now capturing data from all the required sources," adds Foong. "We also identified a number of additional use cases, over and above the base Enterprise Security case, such as rapidly troubleshooting performance degradation."

Now that Netwealth has implemented Splunk, the software has further applicability across the business. The next step is continuing to leverage Splunk, and JDS will be there to help.

Business Benefits

  • Gave Netwealth better visibility into the organisation’s security posture
  • Presents the opportunity for leveraging of Splunk in other areas of the business; for example, marketing
  • Allows Netwealth to have greater visibility into application and business statistics, with the potential to overlay machine learning and advanced statistical analysis of this business information

The Splunk Gardener

The Splunk wizards at JDS are a talented bunch, dedicated to finding solutions—including in unexpected places. So when Sydney-based consultant Michael Clayfield suffered the tragedy of some dead plants in his garden, he did what our team do best: ensure it works (or ‘lives’, in this case). Using Splunk’s flexible yet powerful capabilities, he implemented monitoring, automation, and custom reporting on his herb garden, to ensure that tragedy didn’t strike twice.

My herb garden consists of three roughly 30cm x 40cm pots, each containing a single plant—rosemary, basil, and chilli. The garden is located outside our upstairs window and receives mostly full sunlight. While that’s good for the plants, it makes it harder to keep them properly watered, particularly during the summer months. After losing my basil and chilli bush over Christmas break, I decided to automate the watering of my three pots, to minimise the chance of losing any more plants. So I went away and designed an auto-watering setup, using soil moisture sensors, relays, pumps, and an Arduino—an open-source electronic platform—to tie it all together.

Testing the setup by transferring water from one bottle to another.

I placed soil moisture sensors in the basil and the chilli pots—given how hardy the rosemary was, I figured I could just hook it up to be watered whenever the basil in the pot next to it was watered. I connected the pumps to the relays, and rigged up some hosing to connect the pumps with their water source (a 10L container) and the pots. When the moisture level of a pot got below a certain level, the Arduino would turn the equivalent pump on and water it for a few seconds. This setup worked well—the plants were still alive—except that I had no visibility over what was going on. All I could see was that the water level in the tank was decreasing. It was essential that the tank always had water in it, otherwise I'd ruin my pumps by pumping air.

To address this problem, I added a float switch to the tank, as I was aiming to set it up so I could stop pumping air if I forgot to fill up the tank. Using a WiFi adapter, I connected the Arduino to my home WiFi. Now that the Arduino was connected to the internet, I figured I should send the data into Splunk. That way I'd be able to set up an alert notifying me when the tank’s water level was low. I'd also be able to track each plant’s moisture levels.

The setup deployed: the water tank is on the left; the yellow cables coming from the tank are for the float switch; and the plastic container houses the pumps and the Arduino, with the red/blue/black wires going to the sensors planted in the soil of the middle (basil) and right (chilli) pots. Power is supplied via the two black cables, which venture back inside the house to a phone charger.

Using the Arduino’s Wifi library, it’s easy to send data to a TCP port. This means that all I needed to do to start collecting data in Splunk was to set up a TCP data input. Pretty quickly I had sensor data from both my chilli and basil plants, along with the tank’s water status. Given how simple it was, I decided to add a few other sensors to the Arduino: temperature, humidity, and light level. With all this information nicely ingested into Splunk, I went about creating a dashboard to display the health of my now over-engineered garden.

The overview dashboard for my garden. The top left and centre show current temperature and humidity, including trend, while the top right shows the current light reading. The bottom left and centre show current moisture reading and the last time each plant was watered. The final panel in the bottom right gives the status of the tank's water level.

With this data coming in, I was able to easily understand what was going on with my plants:

  1. I can easily see the effect watering has on my plants, via the moisture levels (lower numbers = more moisture). I generally aim to maintain the moisture level between 300 and 410. Over 410 and the soil starts getting quite dry, while putting the moisture probe in a glass of water reads 220—so it’s probably best to keep it well above that.
  2. My basil was much thirstier than my chilli bush, requiring about 50–75% more water.
  3. It can get quite hot in the sun on our windowsill. One fortnight in February recorded nine 37+ degree days, with the temperature hitting 47 degrees twice during that period.
  4. During the height of summer, the tank typically holds 7–10 days’ worth of water.

Having this data in Splunk also alerts me to when the system isn't working properly. On one occasion in February, I noticed that my dashboard was consistently displaying that the basil pot had been watered within the last 15 minutes. After a few minutes looking at the data, I was able to figure out what was going on.

Using the above graph from my garden’s Splunk dashboard, I could see that my setup had correctly identified that the basil pot needed to be watered and had watered it—but I wasn't seeing the expected change in the basil’s moisture level. So the next time the system checked the moisture level, it saw that the plant needed to be watered, watered it again, and the cycle continued. When I physically checked the system, I could see that the Arduino was correctly setting the relay and turning the pump on, but no water was flowing. After further investigation, I discovered that the pump had died. Once I had replaced the faulty pump, everything returned to normal.

Since my initial design, I have upgraded the system a few times. It now joins a number of other Arduinos I have around the house, sending data via cheap radio transmitters to a central Arduino that then forwards the data on to Splunk. Aside from the pump dying, the garden system has been functioning well for the past six months, providing me with data that I will use to continue making the system a bit smarter about how and when it waters my plants.

I've also 3D printed a nice case in UV-resistant plastic, so my gardening system no longer has to live in an old lunchbox.

Our team on the case

Using Splunk and Active Robot Monitoring to resolve website issues

Recently, one of JDS’ clients reached out for assistance, as they were experiencing inconsistent website performance. They had just moved to a new platform, and were receiving alerts about unexpectedly slow response times, as well as intermittent logon errors. They were concerned that, were the reports accurate, this would have an adverse impact on customer retention, and potentially reduce their ability to attract new customers. When manual verification couldn’t reproduce the issues, they called in one of JDS’ sleuths to try to locate and fix the problem—if one existed at all.

The Plot Thickens

The client’s existing active robot monitoring solution using the HPE Business Process Monitor (BPM) suite showed that there were sporadic difficulties in loading pages on the new platform and in logging in, but the client was unable to replicate the issue manually. If there was an issue, where exactly did it lie?

Commencing the Investigation

The client had deployed Splunk and it was ingesting logs from the application in question—but its features were not being utilised to investigate the issue.

JDS consultant Danesen Narayanen entered the fray and was able to use Splunk to analyse the data received. He could therefore immediately understand the issue the client was experiencing. He confirmed that the existing monitoring solution was reporting the problem accurately, and that the issue had not been affecting the client’s website prior to the re-platform

Using the data collected by HPE BPM as a starting point, Danesen was able to drill down and compare what was happening with the current system on the new platform to what had been happening on the old one. He quickly made several discoveries:

1. There appeared to be some kind of server error.

Since the re-platform, there had been a spike in a particular server error. Our JDS consultant reviewed data from the previous year, to see whether the error had happened before. He noted that there had previously been similar issues, and validated them against BPM to determine that the past errors had not had a pronounced effect on BPM—the spike in server errors seemed to be a symptom, rather than a cause.

Database deadlocks were spiking.
Database deadlocks were spiking
It was apparent that the error had happened before

2. There seemed to be an issue with user-end response time.

Next, our consultant used Splunk to look at the response time by IP addresses over time, to see if there was a particular location being affected—was the problem at server end, or user end? He identified one particular IP address which had a very high response time. What’s more, this was a public IP address, rather than one internal to the client. It seemed like there was a end-user problem—but what was the IP address that was causing BPM to report an issue?

Daily response time for all IPs (left axis), and for the abnormal IP (right axis). All times are in seconds.

Tracking Down the Mystery IP Address

At this point our consultant called for the assistance of another JDS staff member, to track down who owned the problematic IP address. As it turned out, the IP address was owned by the client, and was being used by a security tool running vulnerability checks on the website. After the re-platform, the tool had gone rogue: rather than running for half an hour after the re-platform, it continued to open a number of new web sessions throughout the day for several days.

The Resolution

Now that the culprit had been identified, the team were quickly able to log in to the security tool to turn it off, and the problem disappeared. Performance and availability times returned to what they should be, BPM was no longer reporting issues, and the client’s website was running smoothly once more. Thanks to the combination of Splunk’s power, HPE's active monitoring tools, and JDS’ analytical and diagnostic experience, resolution was achieved in under a day.

JDS is now a CAUDIT Splunk Provider

Splunk Enterprise provides universities with a fast, easy and resilient way to collect, analyse and secure the streams of machine data generated by their IT systems and infrastructure.  JDS, as one of Australia’s leading Splunk experts, has a tradition of excellence in ensuring higher education institutions have solutions that maximise the performance and availability of campus-critical IT systems and infrastructure.

The CAUDIT Splunk offering provides Council of Australian University Directors of Information Technology (CAUDIT) Member Universities with the opportunity to buy on-premise Splunk Enterprise on a discounted, 3-year basis.  In acknowledgement of JDS’ expertise and dedication to client solutions, Splunk Inc. has elevated JDS to a provider of this sector-specific offering, meaning we are now better placed than ever to help the higher education sector reach their data collection and analysis goals.

What does this mean for organisations?

Not-for-profit higher education institutions that are members of CAUDIT can now use JDS to access discounted prices for on-premises deployments of Splunk Enterprise.  JDS are able to leverage their expertise in Splunk and customised solutions built on the platform, in combination with their insight into the higher education sector, to ensure that organisations have the Splunk solution that meet their specific needs.

Secure organisational applications and data, gain visibility over service performance, and ensure your organisation has the information to inform better decision-making.  JDS and Splunk are here to help.

You can learn more about JDS’ custom Splunk solutions here:  JDS Splunkbase Apps

How operational health builds business revenue

Splunk IT Service Intelligence (ITSI) is a next-generation monitoring and analytics solution that provides new levels of visibility into the health and key performance indicators of IT services. Use powerful visualizations and advanced analytics to highlight anomalies, accelerate investigations and pinpoint the root causes that impact service levels critical to the business.Join this session to learn how to:

  • Translate operational data into business impact.
  • Provide cross-silo visibility into the health of services by integrating data across the enterprise.
  • Visually map services and KPIs to discover new insights.
  • Transform machine data into actionable intelligence.

What is Service Intelligence?
IT operations is responsible for running and managing the services that businesses depend on. Service intelligence improves service quality, helps IT make well-informed decisions and supports business priorities.

Why Splunk IT Service Intelligence?
Splunk ITSI transforms machine data into actionable intelligence. It provides cross-silo visibility into the health of services by integrating data across the enterprise, visually mapping services and KPIs to discover new insights, and translating operational data into business impact. With timely, correlated information on services that impact the business, Splunk ITSI unifies data silos, reduces time to resolution, improves service operations and enables service intelligence.

ensure IT works with

Splunk: Using Regex to Simplify Your Data

Splunk is an extremely powerful tool for extracting information from machine data, but machine data is often structured in a way that makes sense to a particular application or process while appearing as a garbled mess to the rest of us. Splunk allows you to cater for this and retrieve meaningful information using regular expressions (regex).

You can write your own regex to retrieve information from machine data, but it’s important to understand that Splunk does this behind the scenes anyway, so rather than writing your own regex, let Splunk do the heavy lifting for you.

The Splunk field extractor is a WYSIWYG regex editor.

Splunk 1

When working with something like Netscaler log files, it’s not uncommon to see the same information represented in different ways within the same log file. For example, userIDs and source IP addresses appear in two different locations on different lines.

  • Source 192.168.001.001:10426 – Destination 10.75.001.001:2598 – username:domainname x987654:int – applicationName Standard Desktop – IE10
  • Context [email protected] – SessionId: 123456- desktop.biz User x987654: Group ABCDEFG

As you can see, the log file contains the following userID and IP address, but in different formats.

  • userID = x987654
  • IP address = 192.168.001.001

The question then arises, how can we combine these into a single field within Splunk?
The answer is: regex.

You could write these regex expressions yourself, but be warned, although Splunk adheres to the pcre (php) implementation of regex, in practice there are subtle differences (such as no formal use of look forward or look back).

So how can you combine two different regex strings to build a single field in Splunk? The easiest way to let Splunk build the regex for you in the field extractor.

Splunk 2

If you work through the wizard using the Regular Expression option and select the user value in your log file (from in front of “undername:domainname”) you’ll reach the save screen.
(Be sure to use the validate step in the wizard as this will allow you to eliminate any false positives and automatically refines your regex to ensure it works accurately)
Stop when you get to the save screen.
Don’t click Finish.

Splunk 3

Copy the regular expression from this screen and save it in Notepad.
Then use the small back arrow (highlighted in red) to move back through the wizard to the Select Sample screen again.
Now go through the same process, but selecting the userID from in front of “User.”
When you get back to the save screen, you’ll notice Splunk has built another regex for this use case.

Splunk 4

Take a copy of this regex and put it in Notepad.
Those with an eagle eye will notice Splunk has inadvertently included a trailing space with this capture (underlined above). We’ll get rid of this when we merge these into a single regex using the following logic.
[First regex]|[Second regex](?PCapture regex)

Splunk 5

Essentially, all we’ve done is to join two Splunk created regex strings together using the pipe ‘|’
Copy the new joined regex expression and again click the back arrow to return to the first screen

Splunk 6

But this time, click on I prefer to write the regular expression myself.

Splunk 7

Then paste your regex and be sure to click on the Preview button to confirm the results are what you’re after.

Splunk 8

And you’re done… click Save and then Finish and you can now search on a field that combines multiple regex to ensure your field is correctly populated.