Category: Blog

Purple Teaming – A Happy Cyber Security Family

When considering cyber security, keeping on top of threats is important, and by no means a simple task. As attacks become increasingly sophisticated and harder to detect, our defences need to remain sharp and up-to-date. One approach to improving security that has been gaining popularity is called ‘Purple Teaming’.

In this post, we’ll break down why ‘Purple Teaming’ might be a valuable addition to your ongoing security initiatives.

What is Purple Teaming?

Purple Teaming is essentially about bringing together both sides of the cyber security arena: the Red Team and the Blue Team.

  • Red Teams research and simulate the activities of real-world attackers, including hackers, by probing systems through penetration testing. Using the same tools and techniques as cybercriminals, they help uncover and highlight vulnerabilities before real attackers can exploit them.
  • Blue Teams defend against the attacks of Red Team attack simulations and those of real external attackers. The Blue Team focuses on detecting and responding to threats, often using a SOC or a SEIM platform, and works on strengthening overall defences.

Purple Teaming is a security strategy combining the Red and Blue Teams to form a more holistic view of cyber security. When a Purple Team engagement is initiated, rather than working separately in an adversarial capacity, both the Red and Blue Teams will work together and learn from each other to create a stronger, more cohesive security posture.

What is the effectiveness of Purple Teaming?

One of Purple Teaming’s greatest strengths is that it is an arrangement of cooperation between both the defensive and offensive sides of cyber security. By combining the offence of a Red Team with the defence of a Blue Team, it is possible to develop a stronger and more in-depth security posture.

Within a Purple Team engagement, the Red Team will simulate attacks to identify vulnerabilities or gaps in security, while the Blue Team actively monitors and attempts to defend against any detected attacks. The Purple Team as a whole will use the information that is generated by the attacks, in addition to what is reported by the Red Team, to improve on existing defence strategies, and to develop more effective monitoring, detection, mitigation, and recovery techniques.

Normally Red and Blue Teams work separately, often in an adversarial capacity; however, when operating as a Purple Team, the Red and Blue Teams work together to share knowledge and insights that may otherwise be unknown or not considered. While Red Teams share their latest attack techniques, the Blue Teams offer tips or advice on how they monitor and prevent the attacks, which can allow the Red Team to further develop possible bypass techniques for the Blue Team to work on detecting. This creates a constant cycle of improvement for both teams, and identifies areas where there may be opportunities to upskill.

This type of cooperation not only helps in the identification of new or existing vulnerabilities, but also assists in the development of more effective incident response plans, playbooks, and guidelines, as well as the configuration of monitoring and detection tools, such as a SIEM dashboard or alerts. This level of active communication and improvement helps to stay on top of even the latest threats, and increase the speed of response for any incident that may arise.

Why You May Want to Consider Purple Teaming

Purple Teaming offers a unique combination of offensive and defensive strategies, which can provide numerous benefits across various aspects of your organisation’s cybersecurity efforts. Beyond just improving security posture, this collaborative approach fosters deeper learning, stronger relationships between teams, and greater resilience against evolving threats.

Here are some of the key outcomes you can expect from adopting Purple Teaming:

  • Improved Incident Mitigation, Response, and Recovery:
    By looking at both sides of the cyber security coin, your Blue Team is more able to quickly identify threats and have the knowledge and experience on how to stop them in their tracks. By understanding not only the commonly used, but also the niche attacks, your teams will be better informed to implement procedures that effectively minimise any impact or expedite the required recovery following an incident.
  • Enhanced Threat Intelligence:
    The dynamic nature of Purple Teaming ensures that both offensive and defensive perspectives are considered, helping your teams to keep up-to-date with the latest attack vectors and vulnerabilities, while patching security gaps in real time.
  • Training and Development:
    Teamwork is important. Purple Teaming encourages ongoing learning and skill-sharing between Red and Blue Teams, fostering an environment where information, techniques, and tools are openly exchanged. This cooperation shifts the mindset from an adversarial ‘Us vs Them’ mentality, to that of a unified team working toward the common goal of strengthening security.

To stay ahead of cyber threats, organisations must adopt a proactive and cooperative approach. Purple Teaming offers the perfect blend of offensive and defensive strategies to enhance your security posture, improve response times, and foster collaboration among your cybersecurity teams. By embracing this methodology, your organisation can build a stronger defence while continuously learning and adapting to new threats. Ultimately, the strength of Purple Teaming lies in its ability to drive constant improvement, making it a valuable inclusion in any security strategy.

Tech Tip: Adding a pop-up extension to a Splunk Dashboard

Contributed by Jade Bujeya

My manager said: “I was thinking it might be good to have a pop-up that allows people to leave feedback on our dashboards.”

Like any true-born nerd, I said: “Pick me! Pick me!”

Google Forms are for lesser mortals.

Thus began my mission to add a pop-up extension to a Splunk dashboard. While I’m sure there are other ways to do this, my approach was to use a JavaScript extension which would provide the additional objects and functions I needed to make my pop-up interactive.

According to Codecademy: “JavaScript is a programming language that adds dynamic functionality and complex features like interactivity and animation to web pages. Together with HTML and CSS, JavaScript forms the foundation of web development.”

Now web design is a broad and complex topic, worthy of its own blog post, or indeed its own blog. Essentially, HTML creates objects on the screen that you can see, CSS controls how these objects look, and JavaScript controls how they behave.

Theoretically, you can use HTML and Splunk source code to add buttons and popups to a dashboard, however I preferred to use the extensions method due to the potential for greater customisability. This is done by adding script=”my_code_file.js” inside the <form> or <dashboard> tag as seen in the example below:

For extra credit, you can also add stylesheet=”my_style_sheet.css” here to control the design of your JavaScript objects.

After a few internet searches, and with the help of our expansive and enthusiastic community of Splunkers, I quickly found an example I could use as a starting point, which created a ‘hidden’ object that only became visible when a button was clicked. Alternatively, this same functionality could be achieved by using the <change> and <condition> tags offered within the Dashboard Editor interface.

The ‘hidden’ object was a JavaScript constant that contained a long string of HTML describing the popup I wanted. This HTML was appended to the dashboard code, and then made visible when needed using one of several JavaScript functions outside the main constant with dictated functionality.

Amongst other things, such as confirming that field contents were valid, these functions would initiate the running of a search using the ‘outputlookup’ command. In this way, user responses could be added to a predefined lookup, enabling them to be displayed and utilised later.

In later phases of the project, I also built in a feature that would attempt to prevent a user from submitting feedback under someone else’s name. This works by creating a dummy search, which automatically runs when the user opens the popup. While the search produces no results, it does create a record in the _audit index. This record contains the Splunk username of the user who ran the dummy search, which is then added to the new line being created in the lookup as the ‘User’ who is submitting the feedback.

It goes without saying that this is not a foolproof approach, and is one which would likely become unreliable if many users were trying to leave feedback at the same time. Inevitably, there would be a small gap between the creation of the record in the _audit index and its retrieval, which might result in the wrong record from _audit being used to assign the user. However, for the relatively limited number of users in my case, it worked superbly.

Benefits of my approach:

  • I could see and edit the entire pop-up as one block of text using simple and well-supported web design languages.
  • I could easily integrate other JavaScript functions to control different aspects of the form’s behaviour and could edit all of it in one single document.

Drawbacks of my approach:

  • This method required knowledge and understanding of both HTML and JavaScript.
  • There were considerable complexities involved in passing HTML into a JavaScript constant, which would then be pasted as a HTML addendum at the bottom of a Splunk dashboard.
  • Testing was a bit arduous, as to ensure Splunk recognises the changes you’ve made to a file, it is necessary to clear both the browser and server caches. While this can certainly be done, I found it faster to solve the problem by adding a constantly changing version number to the file name, so that Splunk would keep reading it as a new file.
  • There were some characters (e.g. quotation marks etc.) that I had trouble passing into strings, as they would get confused while being passed from one language to another.

The resulting code used to add a pop-up extension to a Splunk dashboard is displayed below.

Happy Scripting!

require(['splunkjs/mvc',
'splunkjs/mvc/searchmanager',
'splunkjs/mvc/simplexml/ready!'],
// required packages
function(mvc, SearchManager){
               var updateCSV = new SearchManager({
                id: "updateCSV",
                autostart: false,
               cache:false,
                search : "| makeresults | eval feedback=\"$setMsg$\" | eval dashboard=\"$setDsh$\" | eval name=\"$setName$\"| eval score=\"$setScore$\" | append [| search index=_audit | regex search=\"index=not_an_index sourcetype=not_a_sourcetype\" | fields user] | stats latest(_time) as _time, latest(dashboard) as dashboard, latest(feedback) as feedback, latest(name) as name, latest(score) as score, latest(user) as user | inputlookup append=true feedback.csv | outputlookup feedback.csv"
                  },{tokens: true});
                  //Creates function to run a search that creates an event with a series of fields populated by user entered tokens and then saves that event to a lookup file
                 //See Below: … | append [| search index=_audit | regex search=\"index=not_an_index sourcetype=not_a_sourcetype\" | fields user] | stats latest(_time) as _time, latest(dashboard) as dashboard, latest(feedback) as feedback, latest(name) as name, latest(score) as score, latest(user) as user
                 // This (^) goes into the _audit index, and retreives the 'user' based on a dummy search that is automatically run with your user context when you click    

    var markerSearch = new SearchManager({
            id: "markerSearch",
            autostart: false,
    cache:false,
            search : "| search index=not_an_index sourcetype=not_a_sourcetype",
            },{tokens: false});
            //this is the dummy search that creates a record in _audit

let params = (new URL(document.location)).searchParams;
const contents = document.createElement('contents');
// creates the below HTML and adds it to a variable called 'contents' seen below

contents.innerHTML = `
<div class="chat-popup" id="myForm">
    <form class="form-container">
        <h1>Feedback</h1>
        <div style="display: table">
            <div style="display: table-cell; padding-left: 10px">
            <label for="user">
                <b>Name</b>
            </label>
            <input type="text" name="name" id="name">
            </input>
            </div>
        </div>
        <div style="display: table">
            <div style="display: table-cell; padding-left: 10px">
            <label for="dshbrd">
                <b>Good 10 - 1 Bad</b>
            </label>
            <input type="number" name="score" id="score" min="1" max="10" required>
            </input>
            </div>
            <div style="display: table-cell; padding-left: 10px">
            <label for="dshbrd">
                <b>Select Dashboard:</b>
            </label>
            <select id="dshbrd">
                <option>DashboardName1</option>
                <option>DashboardName2</option>
                <option>DashboardName3</option>
                <option>DashboardName4</option>
                <option>DashboardName5</option>
                <option>DashboardName6</option>
                <option>DashboardName7</option>
                <option>DashboardName8</option>
                <option>DashboardName9</option>S
                <option>DashboardName10</option>
                <option>DashboardName11</option>
            </select>
            </div>
        </div>
        <label for="msg">
            <b>Message</b>
        </label>
        <textarea placeholder="Type Feedback..." name="msg" id="msgFeedback" onchange="msgFeedback.value = msgFeedback.value.replace(/&quot;/g, '')" required></textarea>
        <span id="validationFeebback"></span>
        <button id="sbmtFeedback" type="button" class="btn">Submit</button>
        <button id="cnclFeebackPopUP" type="button" class="btn cancel">Close</button>
    </form>
</div>
`    
$(document).find('.dashboard-body').append('<button id="feedback" class="btn btn-primary">Provide Feedback</button>');
// creates the feedback button and adds it to the screen. As this is a btn type item, the default behaviour is 'show'.
$(document).find('.dashboard-body').append(contents);
// adds contents to the screen. As 'contents' is a chat-popup type item, the default behaviour is 'hidden' (see .css file).

$("#feedback").on("click", function (){
    $(document).find('.chat-popup').show();
    markerSearch.startSearch();
    // runs the above marker (dummy) search 
});

$("#cnclFeebackPopUP").on("click", function (){
    $(document).find('.chat-popup').hide();
    window.location.reload(true);
});
// hides the popup when the user clicks cancel

$("#sbmtFeedback").on("click", function (){
    var msg=$('#msgFeedback').val();
    var dsh=$('#dshbrd').val();
    var name=$('#name').val();
    var score=$('#score').val();
    if (msg.length<=10 || (msg.length==1 && msg==" ")){
        $(document).find("#validationFeebback").text("Invalid Feedback. Must be more then 10 characters").css({'color':'red',});
    }
    else{
        var tokens = splunkjs.mvc.Components.get("default");
            tokens.set("setMsg", msg);
            tokens.set("setDsh", dsh);
            tokens.set("setName", name);
            tokens.set("setScore", score)
        markerSearch.startSearch();
        // runs the above marker search (again, just to be safe)
        updateCSV.startSearch();
        // runs the search to add the new response to the feedback.csv file
        $(document).find("#validationFeebback").text("Your feedback has been submitted..!").css({'color':'green'});
    }
}); 
}
);

Taking the ServiceNow User Experience from OK to Outstanding (Part 2)

As the digital backbone of numerous large enterprises and a pivotal tool for IT services, ServiceNow not only boosts operational efficiency but significantly enhances how users interact with technology on a daily basis. However, creating an optimal user experience (UX) goes beyond just using the software out-of-the-box. It involves thoughtful consideration and understanding of user needs and business processes. Whether you’re a ServiceNow administrator, or a business manager, enhancing UX can lead to better job performance, higher satisfaction, and ultimately, a smoother interaction with your digital tools.

There are a variety of challenges that ServiceNow users may encounter that can hinder their interaction with the platform. 
Complexity: ServiceNow offers an array of functionalities that, while powerful, can be overwhelming for some users. 
Personalisation: Out-of-the-box solutions may not align effectively with specific organisational processes or individual user preferences.
Training: Users with insufficient training may struggle to utilise ServiceNow’s full capabilities.

The repercussions of these common pain points are far-reaching.

Poor UX can result in decreased productivity. If users can’t find what they need or are bogged down by inefficient processes, tasks take longer, and frustration mounts. Faced with a tool that is hard to navigate, or unintuitive, users may try to find workarounds that avoid using it altogether, which leads to inconsistent data or traceability and accountability issues. For the full value of a platform like ServiceNow to be realised by an organisation, its employees must feel confident and empowered when navigating and using the platform.

By applying strategic enhancements that transform the ServiceNow platform into a more user-friendly environment, and focusing on the user’s interactions, needs, and feedback, the platform can be transformed into an even more user-friendly environment, resulting in enhanced productivity and a satisfied workforce. This involves a multi-faceted approach that goes beyond mere cosmetic tweaks, and implements strategies that make ServiceNow not just usable, but a pleasure to use.

The following are just a handful of initiatives that can ensure your ServiceNow platform not only meets the functional needs of users, but also engages them with its intuitiveness and efficiency. 

Tailoring Interfaces and Workflows:
One of the most direct ways to enhance UX is to ensure the interface and workflows best fit the specific needs of users. This means decluttering the interface, removing unnecessary fields, and ensuring that the user journey through a task is logical and minimalistic. For instance, creating simplified forms for commonly repeated tasks can significantly reduce the time and effort users spend on data entry.

Personalising Dashboards and Views:
Every user has different needs based on their role within the organisation. Personalising dashboards so that they display the most relevant information to each user not only speeds up their workflow but also makes the experience more engaging. Utilising ServiceNow’s powerful tools for dashboard customisation enables users to see a snapshot of what matters most to them at a glance.

Simplifying Forms and Data Entry: 
Complex forms are a common barrier in enterprise applications. By simplifying these, perhaps by automating certain inputs or reducing the number of steps in a multi-stage process, you can significantly enhance the user experience. This might include setting default values, auto-filling fields based on previous inputs, or eliminating redundant fields.

Integration with Collaboration Tools:
Integrating the ServiceNow platform with popular collaboration tools such as Slack or Microsoft Teams can enhance communication and collaboration within the platform. This reduces context switching for users and improves efficiency.

Performance Optimisation:
Optimise the ServiceNow instance performance by minimising script execution times, reducing unnecessary database queries, and leveraging client-side caching where appropriate. A snappy and responsive interface contributes significantly to a positive user experience.

Contextual Help and Guidance: 
Implement contextual help features, such as tooltips or inline guidance, to provide users with immediate assistance where they need it. This can help users understand complex fields or processes without having to leave the page.

Ensuring that any enhancements made to improve the user experience are sustained over time also requires a strategic approach. Organisations should be proactively and regularly reassessing user needs, staying informed of platform updates and new features, fostering an internal culture of collaboration, and monitoring user experience metrics to gauge the impact of implemented strategies to make informed decisions for ongoing optimisation. Together, these practices create a cycle of continuous improvement, where user feedback informs iterative refinements, ultimately leading to a ServiceNow environment that is tailored to meet the needs of its users and drive business success.

It’s clear that UX will continue to play a central role in the success of ServiceNow implementations and adoption. By embracing a culture of user-centric design and collaboration, organisations can unlock the full potential of ServiceNow as a platform for delivering exceptional digital experiences.

JDS’s ‘User Experience Review & Analysis’ is specifically designed to help identify and implement the most effective enhancements to your unique ServiceNow platform. We conduct a comprehensive review, analysing your current setup to pinpoint areas where UX can be optimised for maximum efficiency and satisfaction, focusing on the three main principles of Available Products and Features, Standards and Governance, and Technology and Security. The end result is a clear and actionable strategy to adapt and modernise the platform, ensuring that ServiceNow remains not ‘just a tool’, but a valuable ally in achieving your organisational goals.

Taking the ServiceNow User Experience from OK to Outstanding (Part 1)

With more and more time spent online, our expectations for a slick and intuitive experience have increased.  This has extended beyond our day-to-day personal activities, to include our online interactions in the workplace. By not providing user-friendly interfaces to their employees, organisations risk disengagement and diminished productivity levels.

What is UX?

When we talk about UX in the context of ServiceNow, we’re referring to how users perceive and interact with the platform. A good UX means that ServiceNow is not only functional, but also intuitive, efficient, and tailored to assist users in performing their tasks with minimal friction and maximum satisfaction.

Why UX Matters?

Potential outcomes of a overall negative user experience are:

The relationship between users and technology is tangible, and has a direct impact on their output and satisfaction when using a platform. For most users, this connection is solidified through their interactions with outward-facing interfaces such as a self-service portal or chatbot. For the full value of a platform like ServiceNow to be realised by an organisation, its employees must feel confident and empowered when navigating and using the platform.

Without this level of trust between user and technology, an organisation will find it more difficult to drive adoption of the platform and improve their ways of working. Frustrated users may be prone to reverting back to old ways of getting things done, like emailing someone directly. This can lead to the resurfacing of issues of traceability and accountability that ServiceNow was intended to solve.

Creating A Positive UX In ServiceNow

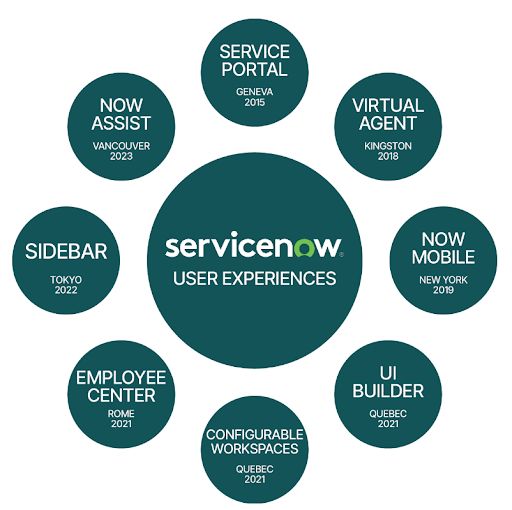
To keep up with user expectations, you need a platform that has its finger on the pulse of modern ways of working. The ServiceNow ecosystem is constantly evolving to meet the changing needs of a modern workplace, with updates providing new interfaces that are focussed on providing engaging experiences to drive productivity with employees and enhance user satisfaction. Updates have previously included:

  • Self-Service with Service Portal
  • Instant Assistance with Virtual Agent
  • Mobile Accessibility with NOW Mobile
  • Modern Design with UI Builder
  • Personalised Experiences with Configurable Workspaces and Employee Center
  • Real-time Collaboration with Sidebar
  • Generative AI Assistance with NOW Assist
How To Keep Up

With trends and expectations evolving so rapidly, it can be hard for organisations to keep up. This can be especially true with regards to user interfaces and experiences, where the benefits may not be easily measurable.

JDS offers a comprehensive package to help organisations uplift their user experiences in ServiceNow to ensure they are getting the most out of the platform. This User Experience Review & Analysis evaluates an organisation’s readiness to improve their user experience in the ServiceNow platform by assessing the current state of the platform against three main principles:

  • Available Products and Features
  • Standards and Governance
  • Technology and Security

The end result is a clear and actionable strategy to adapt and modernise interfaces through which users engage with the ServiceNow platform to improve the overall experience and increase productivity.

Integrating Splunk ITSI and Observability Cloud for Unified Insights

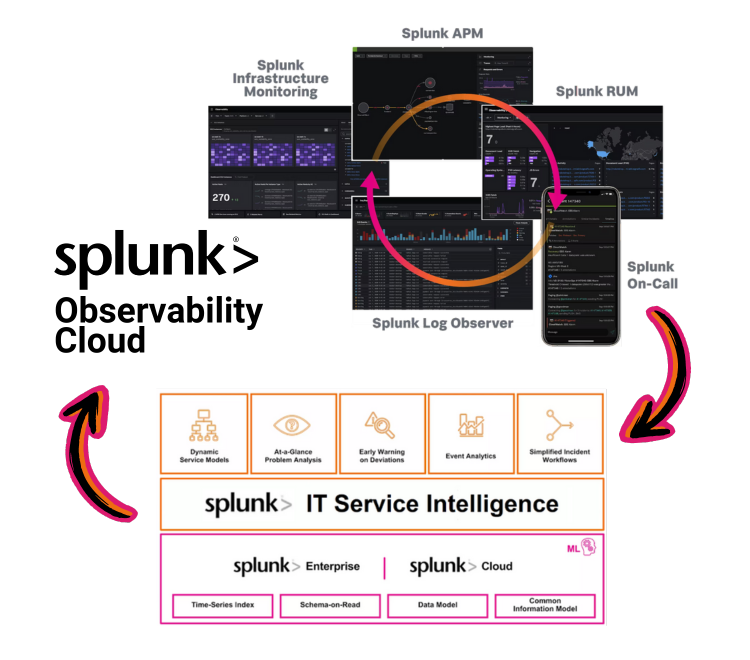
The Splunk Observability Cloud suite (O11y) delivers powerful real-time infrastructure and application monitoring capabilities, while Splunk IT Service Intelligence (ITSI) enables holistic and fully customisable service modelling and impact analysis. When these two technologies are integrated, they effortlessly bridge the gap between tracking infrastructure performance and the overall well-being of your business service.

Making Splunk Core Aware of O11y

A fundamental aspect of integrating ITSI and O11y is making observability metrics available to Splunk Core, and in turn, to Splunk ITSI and IT Essentials Work. For this you’ll need…

This is a Splunk built add-on available on Splunkbase: Splunk Infrastructure Monitoring Add-on.
While the name points to the SIM portion of the O11y suite, the Splunk Infrastructure Monitoring Add-on facilitates access to all O11y metrics, including APM, RUM and Synthetic Monitoring metrics.
NOTE: It is only O11y metric data that can be made available to Splunk Core – not the traces and spans from which these metric results and metadata originate.

SIM Add-on Integration Options

The add-on offers two integration options:
1. Enable Splunk Core to Query O11y Metric Stores
The Splunk Infrastructure Monitoring Add-on introduces a new SPL command called “sim” which allows you to specify a SignalFlow program for querying observability metrics in an SPL search. The SignalFlow program will be run on the remote O11y instance, and the returned metrics can then be processed in the remainder of the SPL search. 

2. Ingesting O11y Metrics into Splunk Indexes
The add-on also contains modular inputs which can be used to index O11y metrics in Splunk Core indexes. You are able to configure these modular inputs by specifying a SignalFlow program which will be run periodically to query the desired O11y metric summaries and index the results in Splunk Core.

NOTE: Ensure that the “stash” source type is always used for the data collected by these modular inputs (as in their default state) so that the collected metrics will not count toward Splunk licence charges.

Where to Install the SIM Add-on

Depending on which integration options are required, the add-on will need to be installed in at least one of these Splunk Core nodes:

Search Heads:
Required on any Search Heads where the “sim” command will be used in SPL searches to query O11y metrics.  In particular, this add-on will be required on Splunk ITSI instances utilising the “sim” command in KPI searches.

Indexers:
Required on any Indexer node/cluster where target metric store indexes are created for ingesting O11y metrics via the SIM add-on modular inputs. The add-on creates an index called “sim_metrics“ which should be used as the default target for O11y metrics as it will not count toward Splunk licence charges (and remember to specify “stash” sourcetype in the modular inputs as noted above).

Forwarders:
Required on any Heavy Forwarder node which will be running the SIM add-on modular inputs to query O11y metrics.

Which Integration Option Is Best?

While it is not possible to give a “one size fits all” answer, consider the following:

The “sim” command is lightning-fast
This is because the metric store of O11y is lightning-fast. By design, the O11y platform is capable of storing and retrieving massive volumes of highly granular data in real time. So performance is rarely a consideration when writing SPL searches using the “sim” command.

The Modular Inputs Duplicate Predetermined Metric Summaries
With the modular inputs of the add-on, you are able to decide ahead of time what O11y metric data you’d like to summarise and index in Splunk Core and at what intervals. While this will only be a subset of the original data that is being indexed, it is still duplication which might not be necessary in a given use case. More to the point, searching the summarised data indexed in Splunk Core lacks the flexibility of using “sim” searches to query metrics directly from O11y, which can be changed on the fly without ever needing to update any modular inputs or re-ingest any data.

Querying O11y directly with the “sim” command would often be the more desirable option.  However, in some scenarios it may be necessary to index O11y metrics in Splunk Core, e.g if security policies prevent certain Splunk Core users from getting direct access to O11y.
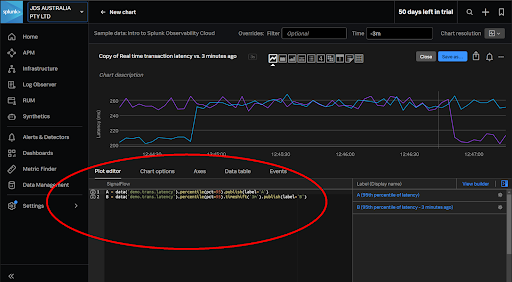
TIP: Use the O11y plot editor to create and test SignalFlow programs which can then be copied into “sim” commands in Splunk Core searches and ITSI KPIs.

Enriching ITSI with O11y Knowledge

The sky’s the limit when modelling systems in ITSI, and for large or complex service models you’ll want to leverage templates and pre-built components instead of re-inventing the wheel.
Content Packs are the mechanism in ITSI for bundling pre-built components, and for O11y content in particular there is…

The Content Pack bundles a set of valuable ITSI knowledge objects which can be leveraged for managing and visualising O11y data, including:
> Services and KPIs
> Service Templates and KPI Base Searches
> Glass Tables and a Service Analyser
> Entity Types and Entity Import Jobs

As with those of any ITSI content pack, many of the above components may not be directly usable for a given use case. They may instead serve as examples or initial templates to the custom content you will be creating.
At the very least, the below entity import jobs from the content pack are invaluable for effortlessly bringing in all O11y-discovered objects to the ITSI entity database:
> ITSI Import Objects – Get_OS_Hosts
> ITSI Import Objects – Get_RUM_*
> ITSI Import Objects – Get_SIM_AWS_*
> ITSI Import Objects – Get_SIM_Azure_*
> ITSI Import Objects – Get_SIM_GCP_*
> ITSI Import Objects – SSM_get_entities_*
> ITSI Import Objects – Splunk-APM Application Entity Search

Whatever the situation, it is in your best interest to install the Content Pack for Splunk Observability Cloud in ITSI when integrating with the O11y suite.

Installing the O11y Content Pack

The latest O11y Content Pack requires the following two add-ons to be installed in the Splunk Core environment first:
> Splunk Infrastructure Monitoring Add-on – The Splunk-built add-on described earlier in this document
> Splunk Synthetic Monitoring Add-on – A SplunkWorks-built add-on (not formally released by Splunk)

Also, if the Content Pack for Splunk Infrastructure monitoring was previously installed in ITSI, then there are additional migration steps to perform before installing the O11y content pack:
> Migrate from the Content Pack for Splunk Infrastructure Monitoring to the Content Pack for Splunk Observability Cloud topic

After the above items are addressed, the method for installing the Content Pack in ITSI is the same as with any other content pack, i.e. via Configuration > Data Integrations > Content Library.
TIP: When installing the content pack, consider using the option of adding a prefix to the names of imported content such as services, service templates and KPI base searches. That way they can be easily identified as examples which can be copied from. This is not so important for items like the entity import jobs (and you may then need to separate imports for differently named objects).

Unified Alerting with O11y and ITSI

In an environment armed with ITSI, an ideal strategy is to consolidate alert management  with ITSI as the central point for processing alerts originating from any Splunk sources such as O11y, as well as from external systems. ITSI’s advanced analytics can be leveraged to implement intelligent alert logic and the alerts actions can interface to Splunk On-Call for escalation management.

This Content Pack is required in ITSI for integrating O11y and ITSI alerting. It comes with correlation searches and aggregation policies that are utilised in the integration procedure (as noted in the High Level Implementation Plan further below).
Installing this Content Pack requires additional version-dependent actions as well as an update to the “Itsi_kpi_attributes” lookup. Please follow the below installation instructions:
Installing and Configuring the Content Pack for ITSI Monitoring and Alerting

Universal Alerting

Splunk have defined the Universal Alerting Field Normalisation Standard in ITSI for which there are pre-built correlation searches provided in the Monitoring and Alerting Content Pack. Normalising alerts to adhere to this schema ensures that alerts from any source can be processed in a common fashion using the pre-built content.
The schema details many fields, many of which are optional, and the following 4 are mandatory for any alert to comply:
> src: the target of the alert, e.g. host, device, service etc.
> signature: a string which uniquely identifies the type of alert
> vendor_severity: the original vendor-specific severity/health/status string
> severity_id: normalised severity

High Level Implementation Plan

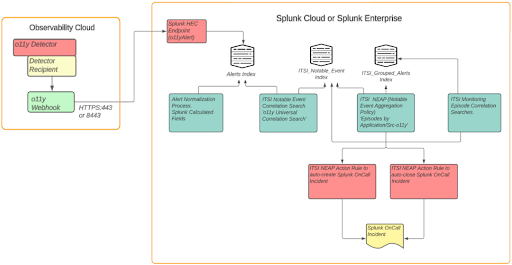
  1. Configure O11y to send alerts to Splunk Enterprise or Cloud Platform:
    This requires creating an alert index in Splunk Core (labelled “Alert Index” in the above diagram), and a HEC endpoint. Then in O11y you can configure a new “Webhook” integration to send alerts to the HEC endpoint.
  2. Normalise O11y alerts to conform to the ITSI Universal Alerting schema
  3. Configure “Universal Correlation Search – o11y” to create notable events:
    This correlation search is shipped with the ITSI Monitoring and Alerting content pack
  4. Configure the “Episodes by Application/SRC o11y” notable event aggregation policy (NEAP):
    Also shipped with the ITSI Monitoring and Alerting content pack
  5. Configure ITSI correlation searches for monitoring aggregated episodes:
    The below 2 searches, also from the content pack:
    “Episode Monitoring – Set Episode to Highest Alarm Severity o11y”
    “Episode Monitoring – Trigger OnCall Incident”
  6. Integrate Splunk On-Call with ITSI:
    This requires installation of the Splunk On-Call (VictorOps) addon in Splunk core, and configuring it with the details of an O11y Splunk On-Call account
  7. Configure action rules in the ITSI NEAP from step 4 for Splunk On-Call Integration
  8. Configure Splunk On-Call with appropriate escalation policies

Full implementation details are documented on the Splunk Lantern site: Managing the lifecycle of an alert from detection to remediation

Next Steps

Now you have the playbook to integrate the Splunk Observability Cloud suite with Splunk ITSI. 
JDS excels in delivering tailored solutions for our customers where we integrate their O11y suite with Splunk ITSI, optimising alert management and reducing Mean Time to Resolution (MTTR).
Reach out if you would like help or advice in improving your observability and troubleshooting efficiency with Splunk Observability Cloud and Splunk ITSI.


Read a recent JDS Customer Success Story here.

Anatomy of a New Relic FSO Dashboard

Full stack observability (FSO) is of paramount importance in today’s digital landscape due to the complexity of applications and infrastructure.  Modern business systems can involve distributed architectures, microservices, and containers, necessitating a holistic view to properly understand how all components interact.  The rise of cloud-native environments and DevOps practices also underscores the need for full stack observability to support resource optimisation, collaboration, and continuous delivery.

The New Relic FSO Dashboard offers a powerful and customisable platform that empowers developers and operations teams with real-time insights and comprehensive data visualisation.

So what does the New Relic FSO dashboard actually look like?

The ‘Business Overview’ dashboard displays important business metrics such as Average Order values By Day, Purchase Volume, Revenue Trend, Sales Funnel, and Abandoned Cart Rate.

In the second tab, the IT Platform Overview dashboard provides detailed information about application and infrastructure performance and status, including availability, daily site visitors, slow pages, most-used features, and mobile device types accessing the platform. This allows for quick identification of issues and prompt corrective actions.

The third tab, Cloud Migration Dashboard, helps track the progress of the migration journey and provides insights into how the cloud environment is being executed. The Percent of On-premises Hosts vs AWS Hosts, Average CPU Usage by AWS vs On-premises Host Location, Total Number of Hosts by Application, and Average Response Time by Host Location are displayed to show the before and after application/host response times, allowing you to determine the extent of improvement in response time after migration. This dashboard enables developers and IT operations teams to monitor the progress of migration in real time.

The User Metrics Dashboard provides an overall view of user behaviour to optimise applications and enhance user experience. It includes metrics such as visitor count, app usage, page visits, average response time, page loading time, and visitor countries/cities.

The Data Analytics Dashboard helps track database performance, identify and resolve performance issues, and the Application Metrics Dashboard provides real-time information on application performance, including response time, error rate, and throughput, allowing for proactive optimisation.

Additionally, there is a dashboard that helps manage AWS costs. Many companies experience difficulties in cost management when migrating to the cloud. In the AWS Budget Overview dashboard, you can examine the total cost divided into actual costs, forecasted costs, and limits. You can also view important metrics such as Pre-production Budget, Total Cost Trends, Budget Trending, and Estimated changes per service. This allows you to track cloud costs in real time and quickly identify areas that require cost optimisation. Furthermore, it provides valuable assistance in planning future budgeting related to the cloud environment.

As a trusted, Gold partner of New Relic, JDS has a team of experts who can not only implement the New Relic FSO dashboard, but also elevate your dashboard experience, take it to the next level, and unleash its full potential.  From designing visually appealing layouts, to fine-tuning performance metrics and alerts, JDS can maximise the value of New Relic’s powerful observability platform. Your applications and users will thank you for it!

The Power of FSO with New Relic

In the sophisticated landscape of today’s IT environments, the journey from telemetry data to business information demonstrates the complexity involved in achieving full-stack observability. Businesses in the throes of digital transformation have found the intricacy of their IT infrastructure compounding. Incorporating modern technologies such as cloud-based systems, microservices, containers, and serverless architectures, along with DevOps and Site Reliability Engineering (SRE) practices, is changing the shape of our technological future.

Observability surpasses traditional monitoring by providing a more comprehensive understanding of ‘why and how‘ an issue occurred. This holistic approach integrates telemetry data—logs, events, metrics, and traces—and presents it on a unified dashboard, unveiling hidden issues and promoting a profound understanding of their root causes. The concept of “observability” offers a departure from traditional IT performance management, providing a comprehensive view of system performance. By combining telemetry data into a unified dashboard, observability allows for an all-inclusive approach to managing cost, resource allocation, and customer experience, addressing the challenges of fragmented data management.

Why is “observability” gaining momentum?

Statistics indicate a significant shift towards multi-cloud usage. This, along with the growing expectation for superior digital experiences, has put enormous strain on IT teams. The challenge lies in delivering innovative features and services at breakneck speeds, while ensuring the seamless operation of existing systems.

JDS sees a lot of over-provisioned cloud-based platforms, as was typical with on-premise configurations. Historically, the main driver for over-provisioning was to cater for spikes, however modern cloud platforms can handle variations in load a lot more effectively. The trick to optimising cloud platforms is to measure and monitor usage. New Relic is a highly efficient tool to help you get the most from your cloud investment.

Conventional IT performance management strategies have hit their peak, instigating the transition towards “observability”. In New Relic’s 2022 Observability Forecast Report, 75% of the 1,614 global respondents confirmed their top-level management’s endorsement of observability technologies. Furthermore, a robust 78% consider observability to be crucial in realising significant business objectives.

One major factor driving the observability market is the availability of new standards and technologies like Open Telemetry (Otel) and extended Berkeley Packet Filter (eBPF). Even with the increase in funding and new technology, data growth is still the main driver behind the explosion of the observability market in recent years. Data is expected to grow at a 35% CAGR through 2025​​.

The New Relic FSO platform offers observability solutions that harness the power of cloud and AI technologies, providing comprehensive functionalities such as telemetry data collection, analysis, visualisation, anomaly detection, and alerts. For those inclined towards open-source observability tools, options such as Prometheus, Grafana, Zabbix, and Jaeger are available.

Why is full-stack observability so important?

Observability isn’t just pivotal for developers, engineers, and IT teams; it’s also crucial for improving customer experience. Real-time monitoring and issue detection are vital for businesses to prevent downtime and ensure optimal performance, avoiding negative impacts on revenue and customer sentiment.

Data-driven decision-making becomes feasible through the vast amount of insight delivered from full stack observability. Organisations can analyse performance metrics, error rates and user behaviour patterns to make informed decisions that improve their products, services, and infrastructure. Additionally, full stack observability can play a crucial role in security monitoring and compliance adherence, with the ability to detect threats and vulnerabilities while meeting regulatory requirements.  

In conclusion, as the digital panorama continues to evolve, the concept of observability has emerged as a key tool in the arsenal of modern businesses. By bridging the technological chasm, it enables a unified, bird’s-eye view of telemetry and business data across disparate teams, thereby amplifying operational efficiency and enriching the digital user experience. 
As we tread deeper into the realm of artificial intelligence, the significance of AI-powered operations (AIOps) is becoming increasingly apparent. This surge in importance is exemplified by the proliferation of observability services now facilitating AIOps environments. Overall, full stack observability empowers businesses to deliver reliable services, remain agile, and drive competitiveness in the dynamic digital realm.

Our favourite announcements from Splunk .conf23

Following an incredible week in Vegas for Splunk .conf23, the JDS team is excited to see all the new and upcoming features for the Splunk platform including AI, Observability, Security and IoT.

Here is a recap of some of our favourite announcements from Splunk .conf23:

Splunk Enterprise 9.1

A new Splunk version was released a week prior to Splunk .conf23, which included some welcome features across the board, the main ones being:

  • Improved ingest action to AWS S3
  • New Federated Search modes
  • New features for Dashboard Studio

Searching logs directly in S3 – without having to ingest them into Splunk, is a widely anticipated feature that according to Splunk Docs, should be generally available very soon. With customers often struggling to balance their licensing for ingestion and retention, this feature will allow customers to keep low-value or old data in S3 while still being able to search it.

Splunk AI Assistant

The newly announced AI Assistant will not only help users find data within the Splunk platform, but will also generate SPL to search and report on it. The AI Assistant app is currently in preview but customers can sign-up to download the app at https://pre-release.splunk.com/preview/aiassist

Splunk Cloud

Splunk and Microsoft have formed a strategic partnership to bring Splunk Cloud to customers that are leveraging Azure as their cloud platform of choice, supplementing Splunk’s existing offerings with AWS and GCP.    

As a result of this partnership, Splunk and Microsoft have committed to developing more “out-of-the-box” integration capabilities. In addition, customers will now be able to spend Azure credits to buy Splunk Core, Enterprise Security and ITSI in their customer-managed environments. This is expected to be rolled out globally over the next year.

Splunk AIOps

Splunk announced the release of the Splunk App for Anomaly Detection. Anomaly Detection is already included in the existing Machine Learning Toolkit (MLTK) app but this new app has a guided wizard which will make setting up Anomaly Detection easier for users that don’t have a background in Machine Learning (ML).

The Deep Learning Toolkit has also received an update (5.1) and a rename to the “Splunk App for Data Science and Deep Learning”. It now includes a “Neural Network Designer Assistant” once again improving the accessibility of ML to those without a ML background.

One other small ML improvement is in ITSI’s Adaptive Threshold feature. Adaptive Thresholds, which dynamically creates thresholds based on historical data, can now be configured to ignore anomalies. For example, a recent P1 incident that resulted in a spike of a KPI will be excluded from threshold calculation, resulting in more accurate thresholds.

Security

TwinWave, which Splunk bought in Nov 2022, has been integrated into the Splunk portfolio and renamed Splunk Attack Analyzer. It boasts a tight integration with Splunk SOAR so that customers can automate the detonation of suspicious URLs and files in unattributable environments and subsequently feed the results back into the SOAR platform.

Enterprise Security Content Update (ESCU) 4.6 has also been released, including 6 new ML detections written by the Splunk Threat Research Team to protect against the latest threats that are being observed in the wild.

Observability 

ITSI 4.17.0 was released at the beginning of June, focusing more on improving the platform than adding new features. A couple of these improvements are:

  • Saved Searches within content packs are disabled by default.
  • A new entity clean-up command which removes searches that are no longer creating or updating entities. 
  • New dashboards to troubleshoot entity discovery issues.
  • KPI sparklines have been updated so they no longer have the “spiky” up & down visual on small time ranges – This was a common complaint from all ITSI customers.
  • Custom dashboards for viewing episodes – Each episode can now show a custom SimpleXML or Dashboard Studio dashboard so customers can customise what is shown inside of the Episode Review page. https://docs.splunk.com/Documentation/ITSI/latest/EA/EpisodeInfo#Add_an_episode_dashboard

Another welcome announcement was the introduction of Unified Identity, which enables users to log into Splunk Observability Cloud with SSO using their Splunk Cloud Platform credentials.

Splunk Edge Hub

Splunk formally announced Edge Hub at .conf, though we’ve already heard of a few organisations trying them out. It’s purpose is to combat the “data deluge” by filtering & aggregating data before it leaves the local network via Internet or internal WAN, but It’s also capable of collecting various environmental sensors (temperature, noise levels, etc) out-of-the-box. Better yet, you can see these stats directly from the built-in screen. We look forward to seeing how customers use these devices in their environments.

Splunk Edge Processor

Splunk has also added some important features to the Edge Processor product. Customers can now export their data to Splunk using Splunk HEC (HTTP Event Collector), which is easier for customers to manage. In addition, the long-awaited SPL2 has also been added to Edge Processor which is interesting because it’s yet to reach many other products (ie Splunk Core). SPL2 extends SPL with many more commands that will make it easier for customers to parse and manipulate their data in Edge Processor before it gets sent into Splunk.

It’s an exciting time for Splunk users, and JDS is pumped to be at the forefront of these latest advancements. 

One Platform. Full Stack. In Context

JDS has a proud history of working with industry-leading tools and ensuring they provide value for your business. We are excited to share that one of our major partners, Cisco, has announced their much-anticipated Full-Stack Observability (FSO) Platform at CiscoLive Las Vegas this month. We have been looking forward to the launch of the FSO platform which will help us unlock much greater value in Observability data. This will benefit our clients by allowing them to bring in a wider variety of data across the app and infrastructure stack, enriched with business context and activity data so you can ensure your tech is optimised for maximum business performance.
https://www.cisco.com/c/en_ca/solutions/full-stack-observability.html?socialshare=lightbox-fso-video

Most of our clients are involved in some level of digital transformation – be it moving to cloud-native or SaaS stacks, simplifying customer experiences with digital apps, or streamlining business processes with smart tech. This has typically meant a lot more moving parts and every time something isn’t right, a new needle-in-the-haystack challenge is presented. Being able to observe a customer’s journey and experience, including all of the technical and business elements involved, pinpoint problems or identify high-value optimisations, is critical for operational success. 

Businesses need the ability to get fast answers to questions like “where is slowness occurring”, “how can we optimise resource usage” or “where can we improve conversion.” Cisco FSO Platform has a ubiquitous and context-rich data platform, with flexible query tools and packaged solutions, to ensure IT is working at its best.

An Overview of the Cisco FSO Platform

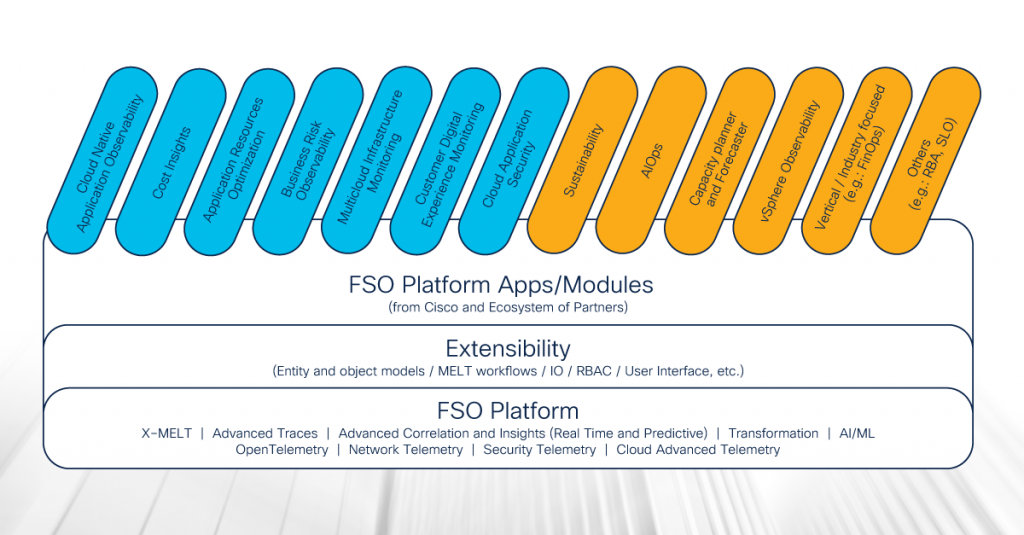
The Cisco FSO Platform was designed from the ground up to provide end-to-end visibility across complex, hybrid and multi-cloud environments. It delivers an extensible, entity-based data model that provides the flexibility to ingest any observability data with business context. By leveraging OpenTelemetry and harnessing the power of Metrics, Events, Logs, and Traces (MELT) to seamlessly collect and analyse data generated by any source, the FSO Platform is a versatile and comprehensive solution to capture observability data across an enterprise.

Right out of the gate there are features for application visibility, security insights, resource and cost optimisation, plus partner-led tools for financial visibility and capacity planning. 


Cloud Native Application Observability

One of the standout features of the Cisco FSO Platform is its Cloud Native Application Observability capability. This feature provides deep visibility into cloud-native environments, allowing organisations to monitor and troubleshoot their applications with ease. By providing insights into digital experiences, ensuring performance alignment with end-user expectations, prioritising actions, and reducing risks, businesses can gain valuable insights into the performance and behaviour of their applications. This allows customers the ability to identify and resolve issues before they impact users.

The Verdict

The Cisco FSO Platform is an innovative solution that offers an impressive suite of features that enable businesses to enhance digital experiences, mitigate risks, and drive operational efficiency.  

The Platform represents a significant milestone in Cisco’s FSO strategy, and shows their commitment to providing a comprehensive observability solution for clients. While other observability platforms can ingest data at scale, they face challenges in understanding and building a view of services.  Cisco’s approach was to build a solution that utilises an entity model at its core, which can be tailored to overcome these limitations. This is crucial with the complexity of modern applications spanning cloud, on-premise, microservices, SaaS, and serverless technologies, yet still needing to understand your customers’ digital journey and experience as they interact with your business. 

We will be keeping a keen eye on developments and look forward to sharing our experiences as we work with our customers to rationalise their observability strategies, harnessing the unique capabilities of the FSO Platform.

Part Three: ServiceNow Hyperautomation – Process Mining

ServiceNow, a leading platform for process mining and automation, recently launched its Utah release with several new features and enhancements, including multidimensional mining.

Part Three of this blog series will explore how you can analyse and improve your IT service management (ITSM) workflows using process mining and automation.

What is Process Mining?

Process mining is a technique that applies data science to discover, validate and improve workflows based on event logs from information systems. It uses artificial intelligence and machine learning to automatically extract process models from your ServiceNow data and visualise them in an interactive dashboard. You can then use the dashboard to identify bottlenecks, inefficiencies, deviations and best practices in your ITSM processes, and take action to optimise them with automation solutions.

How can ServiceNow Process Mining help you to enhance your organisation’s incident management process?

ServiceNow Process Mining can help your organisation enhance your incident management process by providing you with valuable insights into how your process is actually performed, how it deviates from the expected or desired behavior, and how it can be improved.

Process overview shows you the key metrics and statistics of your process, such as the number of cases, the average duration, the throughput time or the compliance rate. You can also filter and segment your data by various criteria, such as category, urgency, assignment group or resolution code.

Process Map provides your organisation with a graphical representation of your process model, which is automatically generated using your data. You can see the flow of cases from start to end, the frequency and duration of each activity, and the variants and deviations of your process. You can also drill down into specific cases or activities to see more details.

Process Analysis presents you the results of various analyses that are performed on your organisation’s process model, such as bottleneck analysis, root cause analysis, conformance analysis and best practice analysis. You can use these to identify and understand the causes and effects of problems and opportunities in your process.

Using these three capabilities, you can gain a comprehensive understanding of your organisation’s incident management process and discover ways to optimise it through elimination of unnecessary steps or automation of repetitive tasks.

Final Thought

As an Elite ServiceNow Partner, JDS can help you navigate the complex and fast-changing world of hyper-automation. We have the expertise, experience and passion to support your organisation’s digital transformation journey. Whether you need to automate your business processes, optimise your IT operations, or leverage artificial intelligence and machine learning, we can guide you every step of the way.

Benefits of migrating to Atlassian Cloud now

There has never been a better time to execute a migration to Atlassian Cloud. 

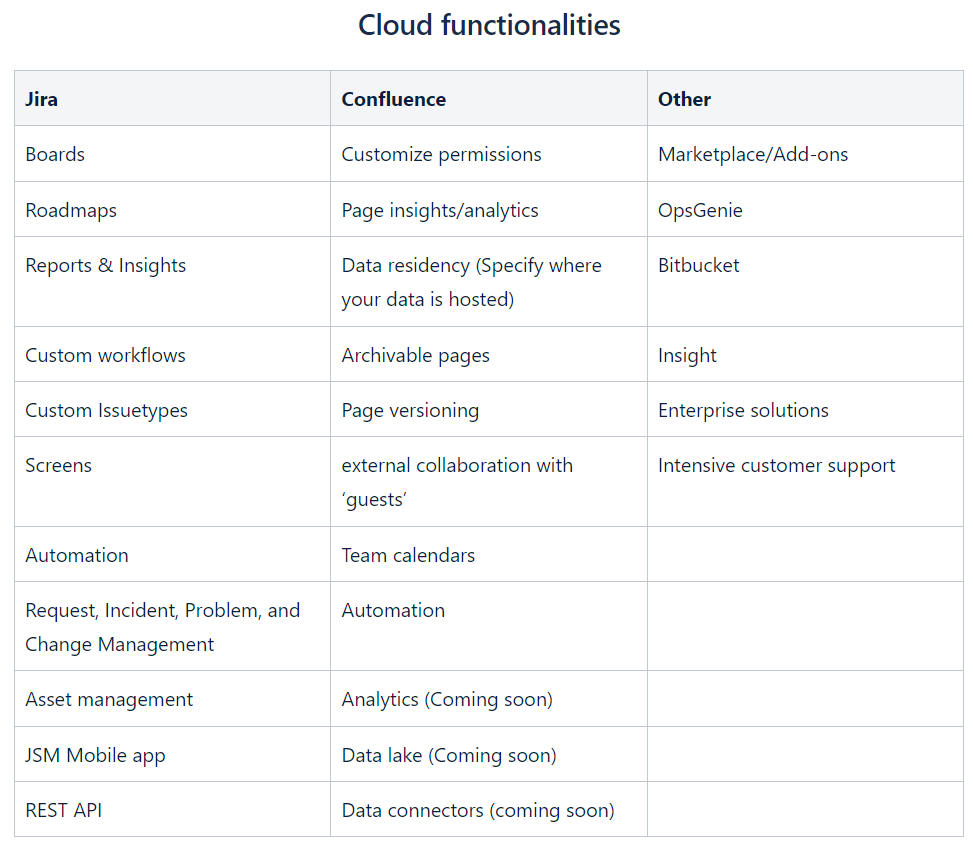
Recent announcements at Atlassian’s Team23 conference included new products (Jira Product Discovery, Beacon), new features (Atlassian Intelligence (AI), Slack/Teams integration, Digital agents), and impressive improvements (Data residency location choice, Portal customization, Workflow and toolchain templates), demonstrating the vast range of opportunities and useful features/products that Atlassian’s cloud platform offers to elevate your service solutions.

Atlassian’s tools continue to grow more effective, efficient, and powerful, leading to improvement in the methods and practices they support.  Dominant technologies like ChatGPT have proven how integrating new technologies into your business can help streamline activities and improve your day-to-day operations to keep your company competitive in the market space. Taking this into consideration, organisations should understand that adopting these tools at the outset is well worth the investment of time and resources to adapt & upgrade internal tooling, methodologies and policies.

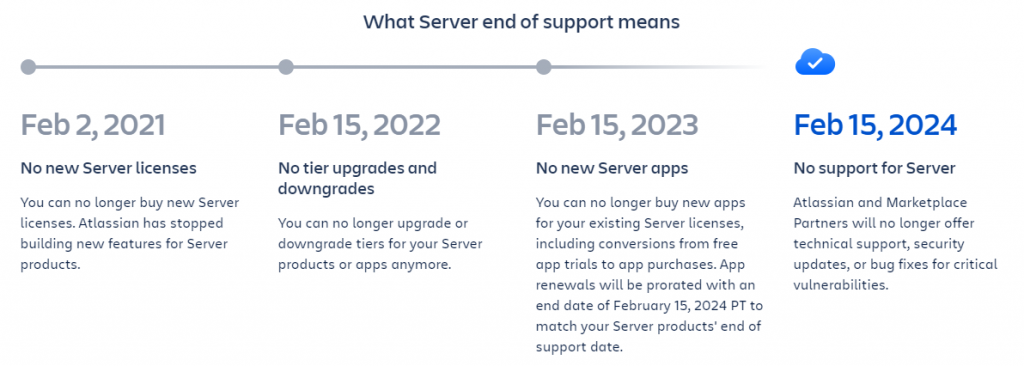
Given that cloud migrations take 3-9 months on average, it is important to commence the move off your server instance into the cloud as soon as you can. In February 2024, Atlassian’s Server End Of Support (EOS) date will lapse and server customers won’t receive any future products, developments, or improvements to their site. Executing a migration now will ensure the business impact is kept minimal and change management has low complexity while guaranteeing you are able to continue utilising everything Atlassian has to offer. 

JDS recommends you carry out the migration before the gap between server and cloud becomes too vast. It will ensure your business receives upgrades and improvements that will keep it adapting to new market climates. Migrating now will also give you greater time to implement change management and adopt new and improved practices, ultimately adding value to your business operations. Migrating before the EOS date will also allow you to integrate the new system into your business while the look and feel of Atlassian Cloud products remain similar to their on-premises server offerings. This will mean that your staff and customers will easily adapt to the new environment without requiring extensive time and resource-consuming activities like upskilling and training.

Atlassian has shown that it has big plans around its product roadmap for the future. Adopting change now will minimise business impact while allowing you to keep your business at the forefront of advancement and technology.  It will also give you a headstart on establishing best practices and refining processes as Atlassian products continue to develop and evolve into the future.

Part Two: ServiceNow Hyperautomation – Proactive Automation Resilience

What is Automation Resilience?

In today’s fast-paced digital landscape, automation is becoming increasingly vital for businesses. However, as with any technology, it’s important to be prepared for unexpected disruptions and failures. This is where automation resilience comes in.

Automation resilience is the ability of an organisation’s automation solutions to withstand unexpected interruptions and recover quickly from failures. Without automation resilience, any downtime or disruptions can lead to significant financial losses and negatively impact the customer experience.

ServiceNow understands the importance of automation resilience, which is why capabilities to enable proactive monitoring and management of automation solutions have been developed. Configuration Management Database (CMDB) is a crucial tool that allows your organisation to track automation solutions and dependencies in the same way you track other facets of your tech stack.

With ServiceNow’s automation resilience capabilities and CMDB, businesses can operate their automation solutions with confidence, knowing that they are prepared for any unexpected disruptions. There is no need for downtime or interruptions to negatively impact your business.

Establishing Proactive Automation Resilience with ServiceNow

Disruptions are inevitable in the fast-paced digitalised business environment, that’s why it’s crucial to have the right tools in place to anticipate, prevent, respond, and adapt to them. ServiceNow’s hyperautomation technologies and capabilities enable organisations to do just that, by leveraging multitudes of technologies.

Intelligence (AI) and data insights are examples of such technology, enabling ServiceNow’s hyperautomation to assist your business with predicting issues, reducing user impact, and streamlining resolutions. It also involves automating the right processes in ServiceNow to improve efficiency, productivity, and customer satisfaction. With ServiceNow, your organisation can serve customers more efficiently, deliver products faster, and protect its workforce more effectively.

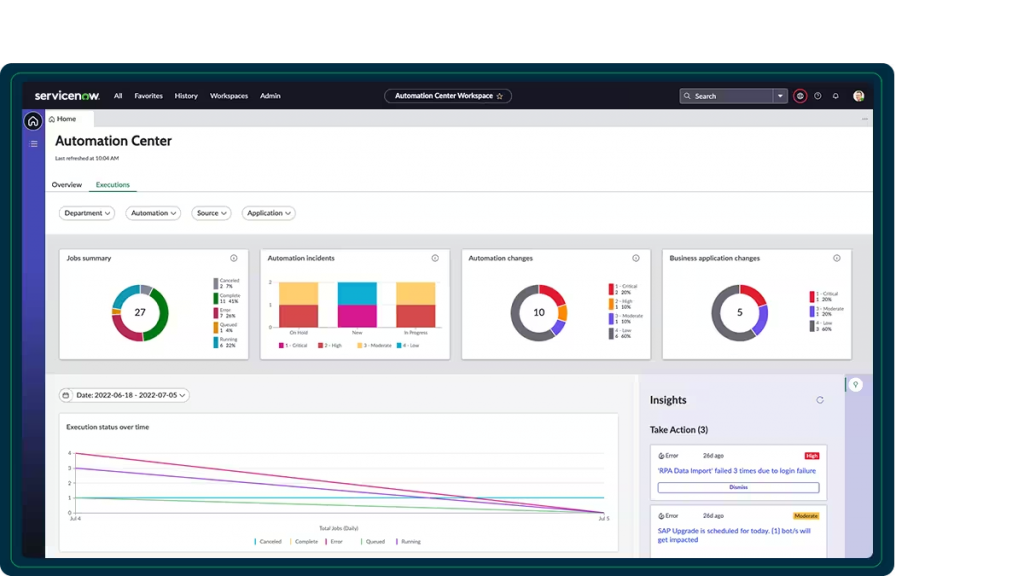
ServiceNow’s automation center allows your organisation to assess every aspect of relevant change management details, not just the execution details of your RPA bots. By viewing a graphic depiction of their bot’s process infrastructure dependencies, organisations can identify potential disruptions such as maintenance windows or unexpected configuration errors.

Moreover, ServiceNow’s AI-powered root cause analysis and automated remediation actions enable your business to effectively reduce mean time to resolution (MTTR). This means that your data can be analysed from various sources, such as logs, metrics, traces, and events, and identify the source of problems in your IT operations. It can also trigger automated workflows and actions to fix issues faster and prevent them from recurring. By doing so, ServiceNow helps your organisation to improve service quality and performance, while shortening the time it takes to resolve incidents.

ServiceNow’s innovative solution empowers your business to gain a competitive advantage by providing exceptional customer experiences and satisfaction. By using insights gained from service quality data, your organisation can proactively communicate with your customers, addressing pain points before they become a problem. With the ability to map out the entire customer journey, your business can tailor your customer service strategy to meet their needs. With ServiceNow’s hyperautomation, you don’t have to wait for disruptions to occur.


Watch: Establish Proactive Automation Resilience | ServiceNow