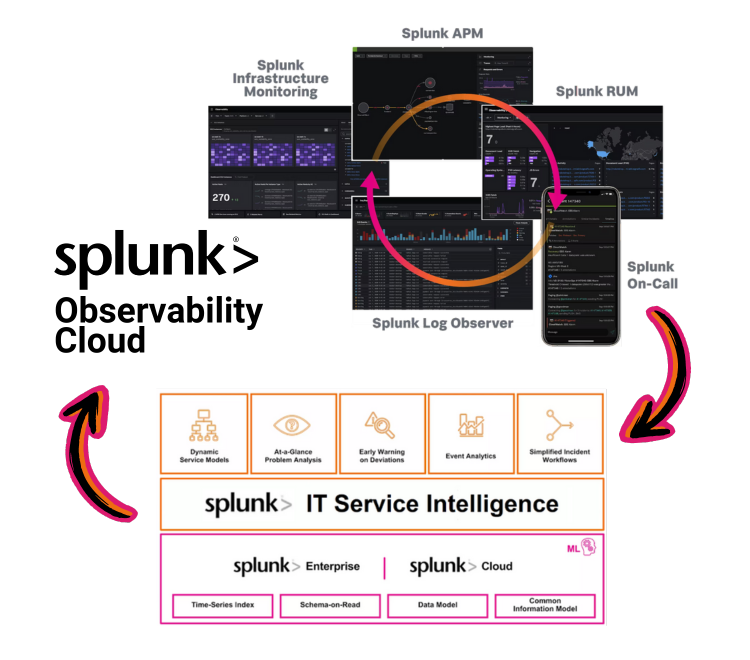
The Splunk Observability Cloud suite (O11y) delivers powerful real-time infrastructure and application monitoring capabilities, while Splunk IT Service Intelligence (ITSI) enables holistic and fully customisable service modelling and impact analysis. When these two technologies are integrated, they effortlessly bridge the gap between tracking infrastructure performance and the overall well-being of your business service.
Making Splunk Core Aware of O11y
A fundamental aspect of integrating ITSI and O11y is making observability metrics available to Splunk Core, and in turn, to Splunk ITSI and IT Essentials Work. For this you’ll need…
The Splunk Infrastructure Monitoring Add-on (SIM)
This is a Splunk built add-on available on Splunkbase: Splunk Infrastructure Monitoring Add-on.
While the name points to the SIM portion of the O11y suite, the Splunk Infrastructure Monitoring Add-on facilitates access to all O11y metrics, including APM, RUM and Synthetic Monitoring metrics.
NOTE: It is only O11y metric data that can be made available to Splunk Core – not the traces and spans from which these metric results and metadata originate.
SIM Add-on Integration Options
The add-on offers two integration options:
1. Enable Splunk Core to Query O11y Metric Stores
The Splunk Infrastructure Monitoring Add-on introduces a new SPL command called “sim” which allows you to specify a SignalFlow program for querying observability metrics in an SPL search. The SignalFlow program will be run on the remote O11y instance, and the returned metrics can then be processed in the remainder of the SPL search.
2. Ingesting O11y Metrics into Splunk Indexes
The add-on also contains modular inputs which can be used to index O11y metrics in Splunk Core indexes. You are able to configure these modular inputs by specifying a SignalFlow program which will be run periodically to query the desired O11y metric summaries and index the results in Splunk Core.
NOTE: Ensure that the “stash” source type is always used for the data collected by these modular inputs (as in their default state) so that the collected metrics will not count toward Splunk licence charges.
Where to Install the SIM Add-on
Depending on which integration options are required, the add-on will need to be installed in at least one of these Splunk Core nodes:
Search Heads:
Required on any Search Heads where the “sim” command will be used in SPL searches to query O11y metrics. In particular, this add-on will be required on Splunk ITSI instances utilising the “sim” command in KPI searches.
Indexers:
Required on any Indexer node/cluster where target metric store indexes are created for ingesting O11y metrics via the SIM add-on modular inputs. The add-on creates an index called “sim_metrics“ which should be used as the default target for O11y metrics as it will not count toward Splunk licence charges (and remember to specify “stash” sourcetype in the modular inputs as noted above).
Forwarders:
Required on any Heavy Forwarder node which will be running the SIM add-on modular inputs to query O11y metrics.
Which Integration Option Is Best?
While it is not possible to give a “one size fits all” answer, consider the following:
The “sim” command is lightning-fast
This is because the metric store of O11y is lightning-fast. By design, the O11y platform is capable of storing and retrieving massive volumes of highly granular data in real time. So performance is rarely a consideration when writing SPL searches using the “sim” command.
The Modular Inputs Duplicate Predetermined Metric Summaries
With the modular inputs of the add-on, you are able to decide ahead of time what O11y metric data you’d like to summarise and index in Splunk Core and at what intervals. While this will only be a subset of the original data that is being indexed, it is still duplication which might not be necessary in a given use case. More to the point, searching the summarised data indexed in Splunk Core lacks the flexibility of using “sim” searches to query metrics directly from O11y, which can be changed on the fly without ever needing to update any modular inputs or re-ingest any data.
Querying O11y directly with the “sim” command would often be the more desirable option. However, in some scenarios it may be necessary to index O11y metrics in Splunk Core, e.g if security policies prevent certain Splunk Core users from getting direct access to O11y.
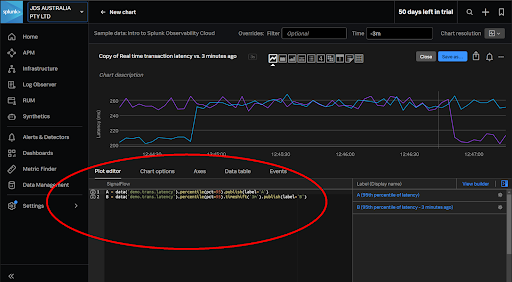
TIP: Use the O11y plot editor to create and test SignalFlow programs which can then be copied into “sim” commands in Splunk Core searches and ITSI KPIs.
Enriching ITSI with O11y Knowledge
The sky’s the limit when modelling systems in ITSI, and for large or complex service models you’ll want to leverage templates and pre-built components instead of re-inventing the wheel.
Content Packs are the mechanism in ITSI for bundling pre-built components, and for O11y content in particular there is…
The Content Pack for Splunk Observability Cloud
The Content Pack bundles a set of valuable ITSI knowledge objects which can be leveraged for managing and visualising O11y data, including:
> Services and KPIs
> Service Templates and KPI Base Searches
> Glass Tables and a Service Analyser
> Entity Types and Entity Import Jobs
As with those of any ITSI content pack, many of the above components may not be directly usable for a given use case. They may instead serve as examples or initial templates to the custom content you will be creating.
At the very least, the below entity import jobs from the content pack are invaluable for effortlessly bringing in all O11y-discovered objects to the ITSI entity database:
> ITSI Import Objects – Get_OS_Hosts
> ITSI Import Objects – Get_RUM_*
> ITSI Import Objects – Get_SIM_AWS_*
> ITSI Import Objects – Get_SIM_Azure_*
> ITSI Import Objects – Get_SIM_GCP_*
> ITSI Import Objects – SSM_get_entities_*
> ITSI Import Objects – Splunk-APM Application Entity Search
Whatever the situation, it is in your best interest to install the Content Pack for Splunk Observability Cloud in ITSI when integrating with the O11y suite.
Installing the O11y Content Pack
The latest O11y Content Pack requires the following two add-ons to be installed in the Splunk Core environment first:
> Splunk Infrastructure Monitoring Add-on – The Splunk-built add-on described earlier in this document
> Splunk Synthetic Monitoring Add-on – A SplunkWorks-built add-on (not formally released by Splunk)
Also, if the Content Pack for Splunk Infrastructure monitoring was previously installed in ITSI, then there are additional migration steps to perform before installing the O11y content pack:
> Migrate from the Content Pack for Splunk Infrastructure Monitoring to the Content Pack for Splunk Observability Cloud topic
After the above items are addressed, the method for installing the Content Pack in ITSI is the same as with any other content pack, i.e. via Configuration > Data Integrations > Content Library.
TIP: When installing the content pack, consider using the option of adding a prefix to the names of imported content such as services, service templates and KPI base searches. That way they can be easily identified as examples which can be copied from. This is not so important for items like the entity import jobs (and you may then need to separate imports for differently named objects).
Unified Alerting with O11y and ITSI
In an environment armed with ITSI, an ideal strategy is to consolidate alert management with ITSI as the central point for processing alerts originating from any Splunk sources such as O11y, as well as from external systems. ITSI’s advanced analytics can be leveraged to implement intelligent alert logic and the alerts actions can interface to Splunk On-Call for escalation management.
The Content Pack for ITSI Monitoring and Alerting
This Content Pack is required in ITSI for integrating O11y and ITSI alerting. It comes with correlation searches and aggregation policies that are utilised in the integration procedure (as noted in the High Level Implementation Plan further below).
Installing this Content Pack requires additional version-dependent actions as well as an update to the “Itsi_kpi_attributes” lookup. Please follow the below installation instructions:
Installing and Configuring the Content Pack for ITSI Monitoring and Alerting
Universal Alerting
Splunk have defined the Universal Alerting Field Normalisation Standard in ITSI for which there are pre-built correlation searches provided in the Monitoring and Alerting Content Pack. Normalising alerts to adhere to this schema ensures that alerts from any source can be processed in a common fashion using the pre-built content.
The schema details many fields, many of which are optional, and the following 4 are mandatory for any alert to comply:
> src: the target of the alert, e.g. host, device, service etc.
> signature: a string which uniquely identifies the type of alert
> vendor_severity: the original vendor-specific severity/health/status string
> severity_id: normalised severity
High Level Implementation Plan
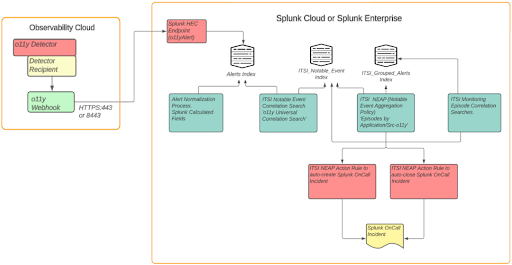
- Configure O11y to send alerts to Splunk Enterprise or Cloud Platform:
This requires creating an alert index in Splunk Core (labelled “Alert Index” in the above diagram), and a HEC endpoint. Then in O11y you can configure a new “Webhook” integration to send alerts to the HEC endpoint. - Normalise O11y alerts to conform to the ITSI Universal Alerting schema
- Configure “Universal Correlation Search – o11y” to create notable events:
This correlation search is shipped with the ITSI Monitoring and Alerting content pack - Configure the “Episodes by Application/SRC o11y” notable event aggregation policy (NEAP):
Also shipped with the ITSI Monitoring and Alerting content pack - Configure ITSI correlation searches for monitoring aggregated episodes:
The below 2 searches, also from the content pack:
“Episode Monitoring – Set Episode to Highest Alarm Severity o11y”
“Episode Monitoring – Trigger OnCall Incident” - Integrate Splunk On-Call with ITSI:
This requires installation of the Splunk On-Call (VictorOps) addon in Splunk core, and configuring it with the details of an O11y Splunk On-Call account - Configure action rules in the ITSI NEAP from step 4 for Splunk On-Call Integration
- Configure Splunk On-Call with appropriate escalation policies
Full implementation details are documented on the Splunk Lantern site: Managing the lifecycle of an alert from detection to remediation
Next Steps
Now you have the playbook to integrate the Splunk Observability Cloud suite with Splunk ITSI.
JDS excels in delivering tailored solutions for our customers where we integrate their O11y suite with Splunk ITSI, optimising alert management and reducing Mean Time to Resolution (MTTR).
Reach out if you would like help or advice in improving your observability and troubleshooting efficiency with Splunk Observability Cloud and Splunk ITSI.
Read a recent JDS Customer Success Story here.