Author: JDS

Understanding your Customer Journeys in Salesforce with AppDynamics

The Problem

JDS Australia works with numerous customers who utilise the force.com platform as the primary interface for their end users (internal and external) to execute business critical services. The flexibility and extensibility of the component based Lightning framework has allowed businesses to customise the platform to meet their specific requirements.

However, many of these companies struggle to monitor, quantify or pinpoint the impact of performance in the Salesforce platform to their end users and ultimately their business. Furthermore, there is limited capability to provide detailed Salesforce information for root cause analysis (e.g. is the problem with a particular lightning component(s) vs core Salesforce platform vs multiple pages?).

The Solution

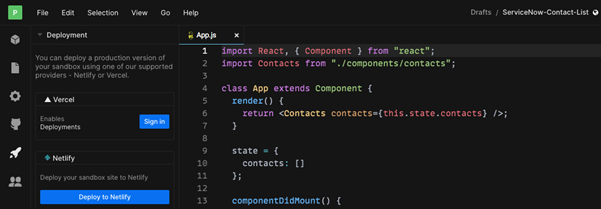
Using AppDynamics Real User Browser Monitoring (RUM) coupled with advanced JavaScript configuration, we have created a solution.

Unlike traditional methods involving logfile or API based monitoring; real user monitoring collects rich metrics from the end users’ perspective. JDS has also further integrated  additional custom code to identify AJAX requests and inject page names into the stream and provide business context and make sense of the data.

Dashboards provide Salesforce Performance at a glance

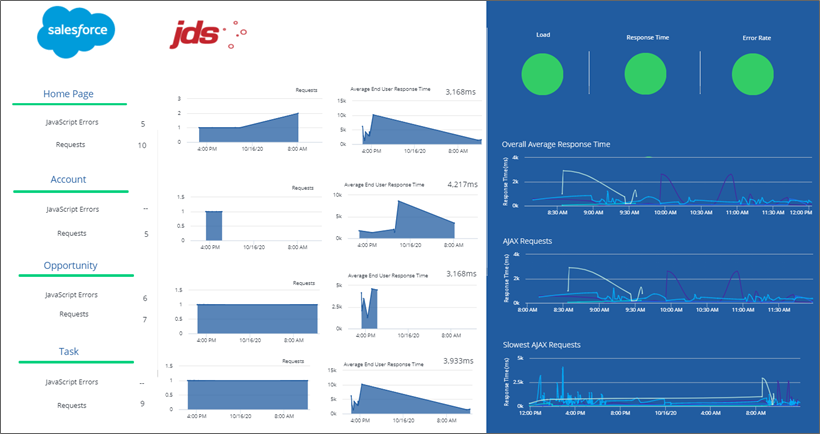
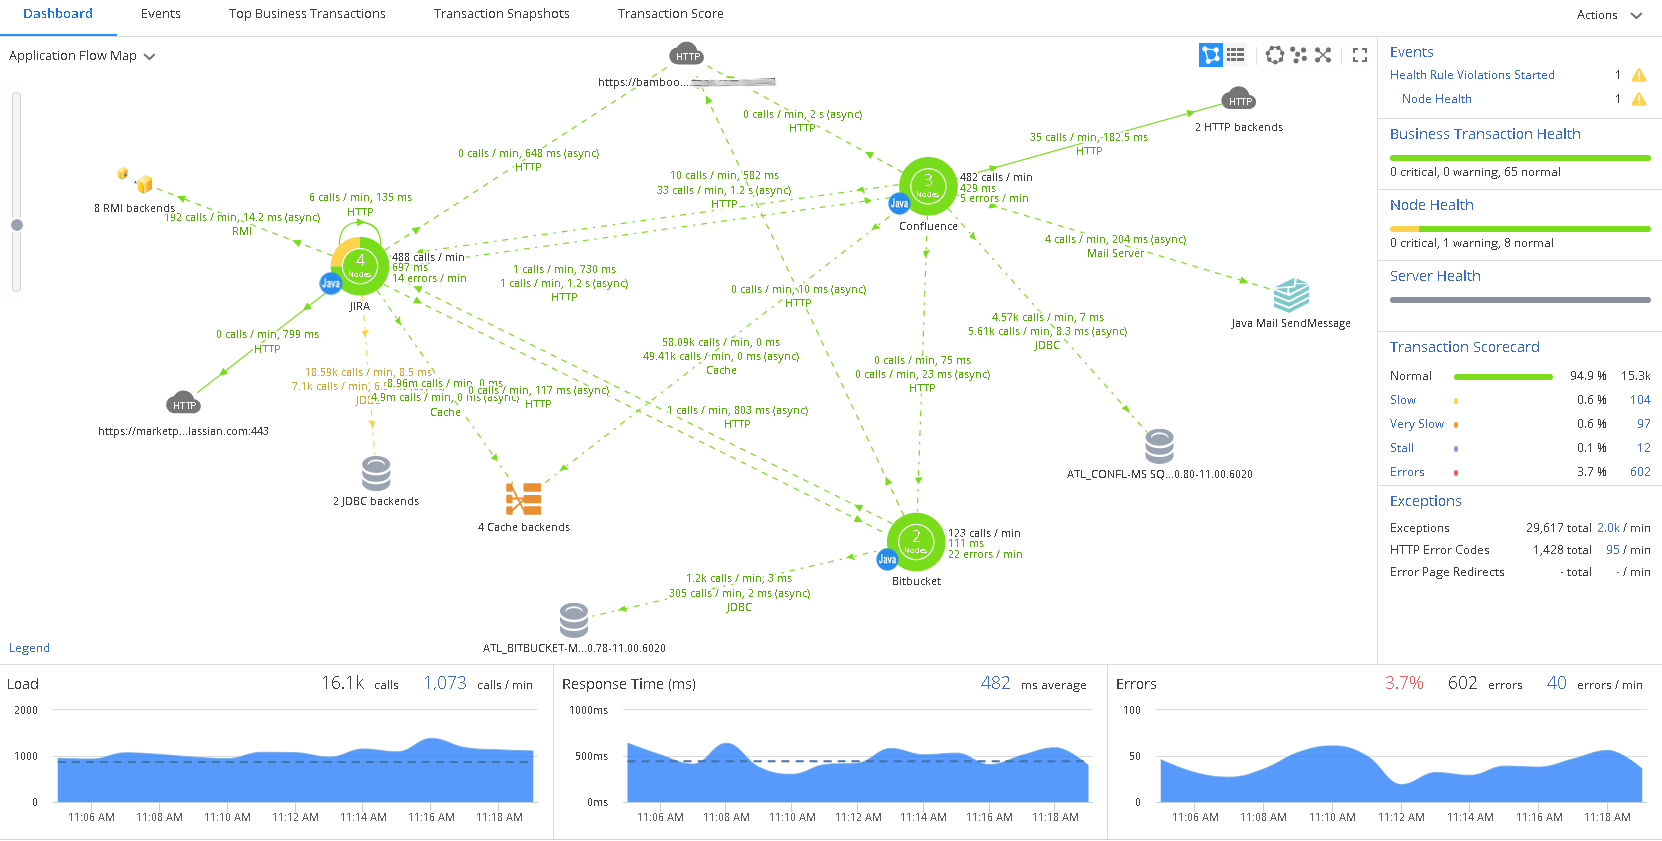
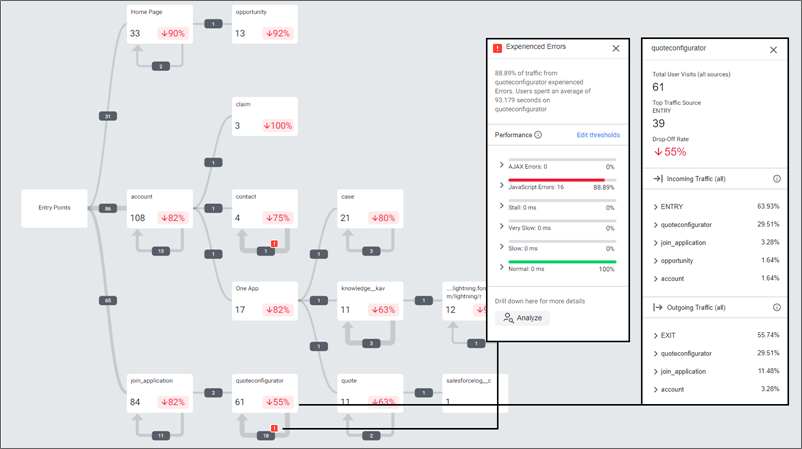
Additionally, AppDynamics RUM is able to identify and dynamically visualise each step of Customer Journeys as they traverse Salesforce, in near real time. 

Using the collated metrics these businesses have been able to proactively alert support teams of issues, and also utilise the historic data to analyse customer behaviour to understand how customers are using the platform. For example, expected user journeys vs actual user journeys.

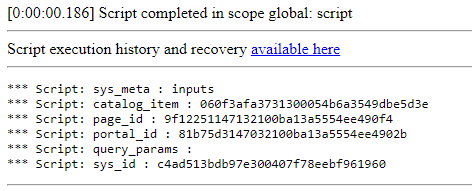
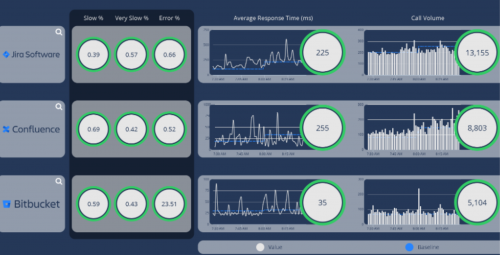
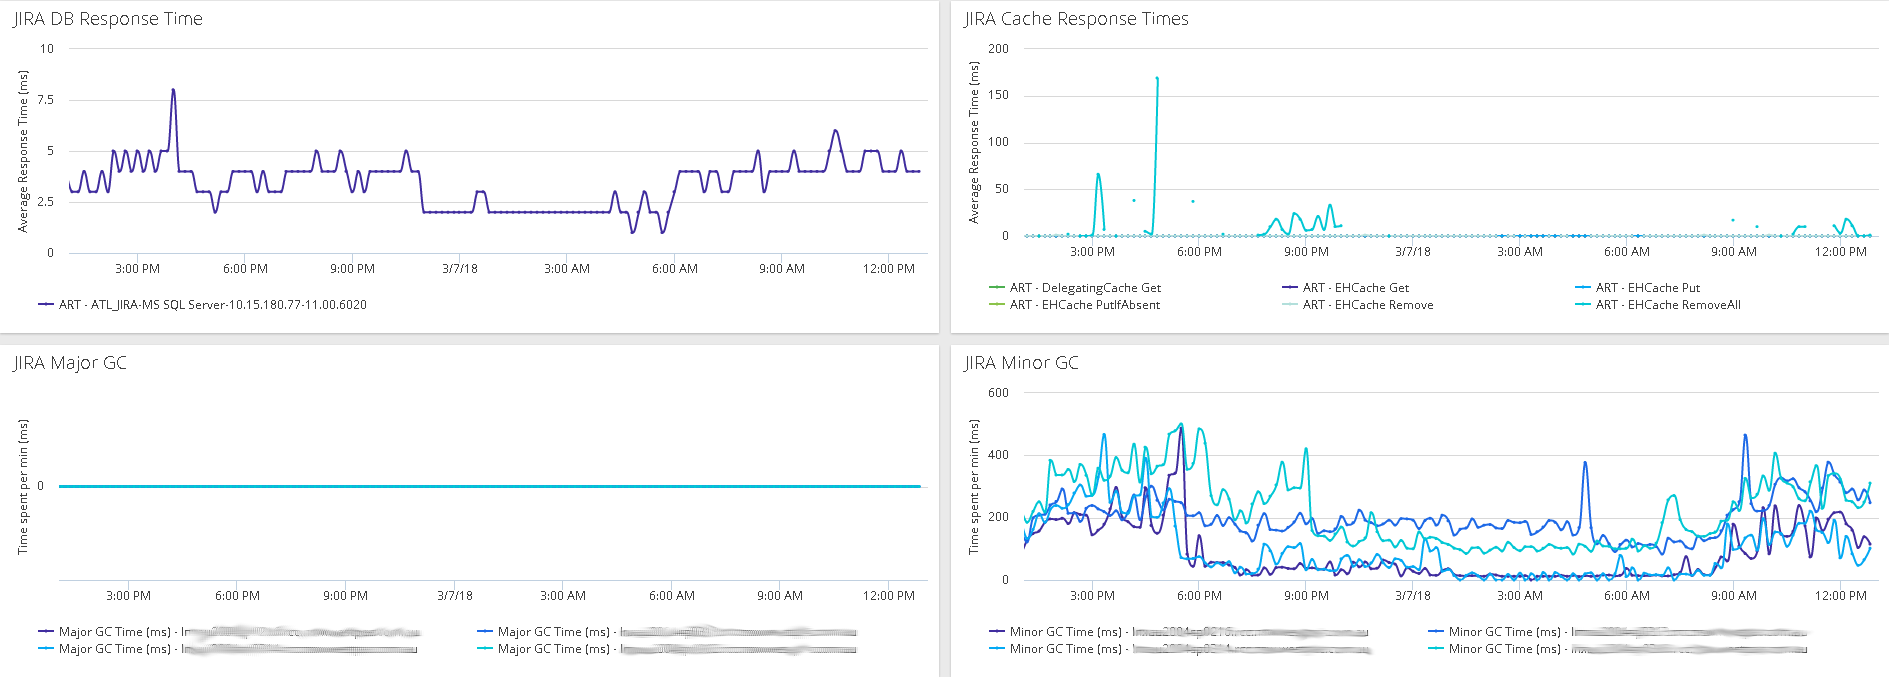
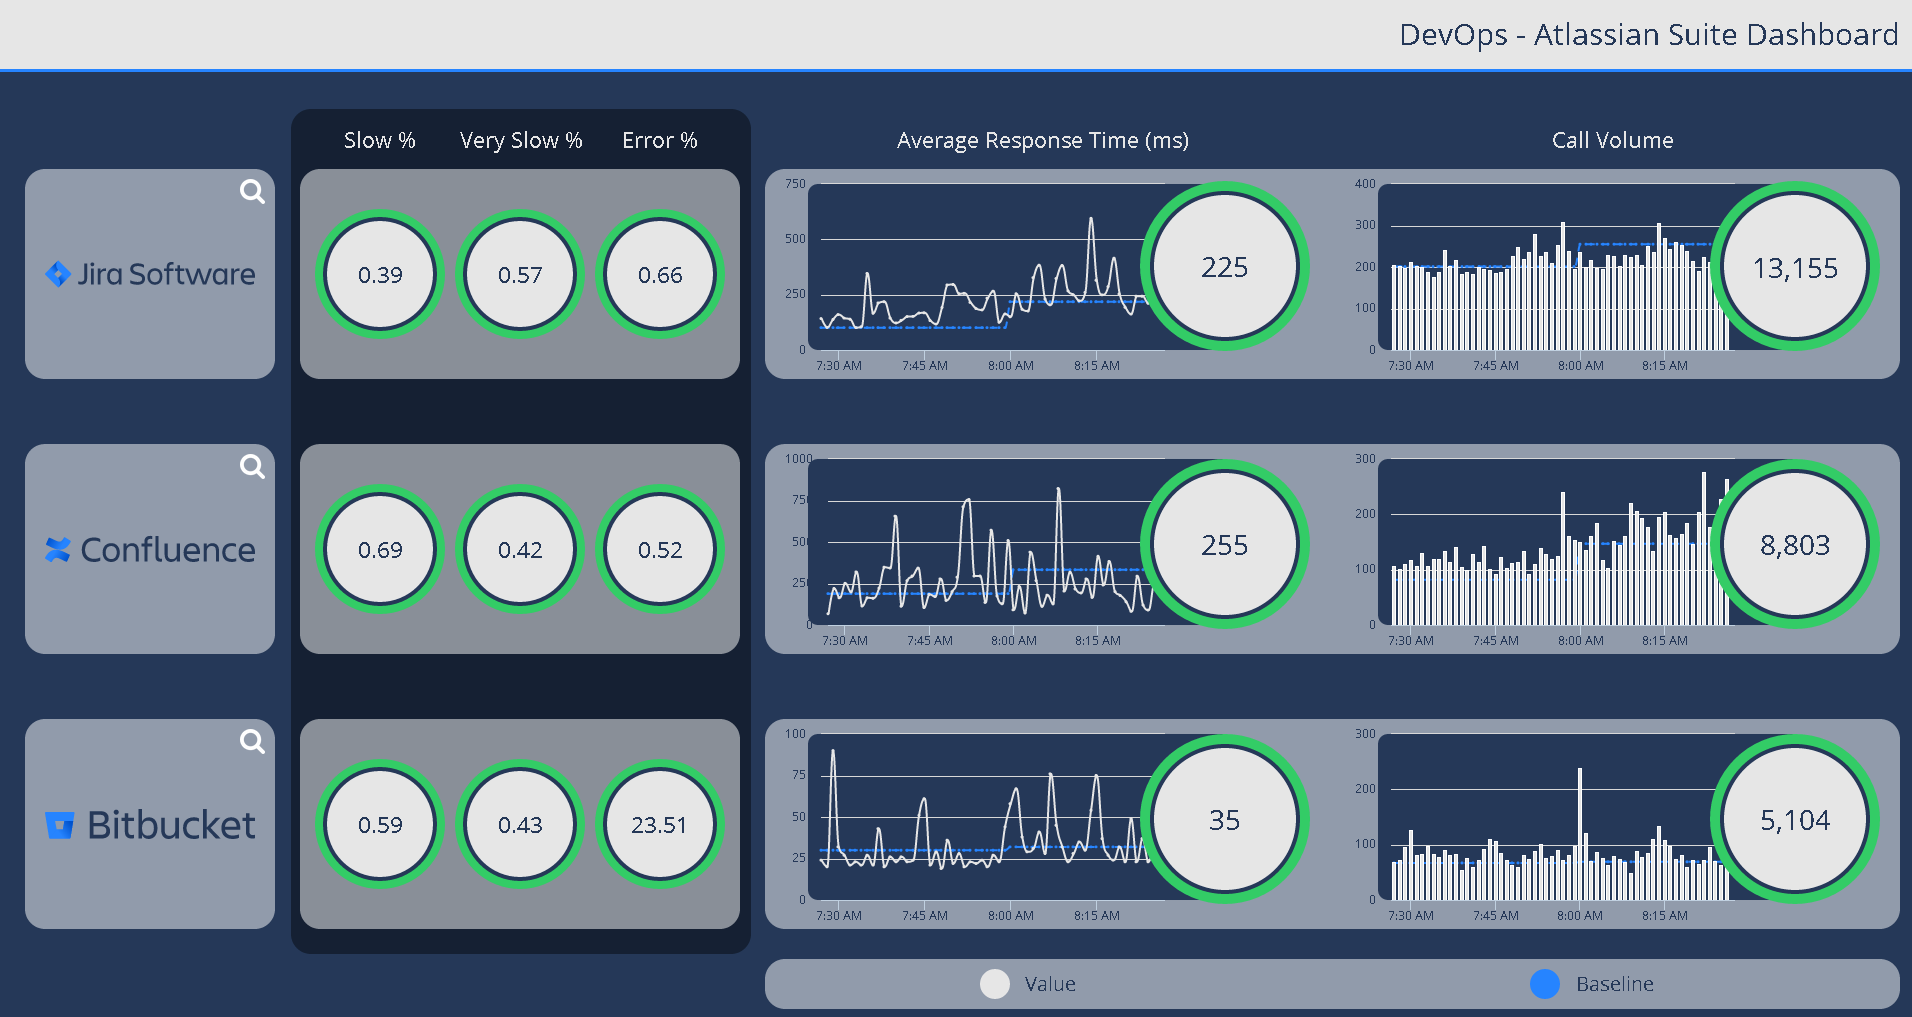
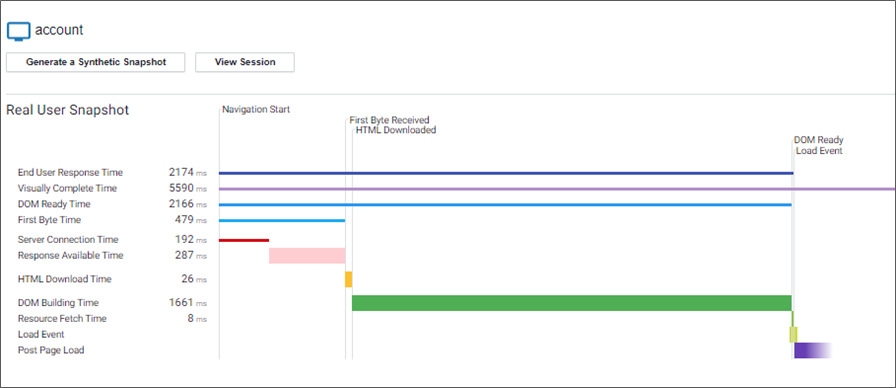
AppDynamics RUM captures detailed diagnostic information to help triage issues, including:

  • Single Page Application performance
  • Page Component load details, 
  • AJAX requests, 
  • Detailed Error Snapshots
  • Dynamic Business Transaction Baselining (Normal vs Slow Performance)
  • User browser version and device type,
  • Geographic location of users,
  • Connection method (e.g. browser vs mobile), and device type. 

AppDynamics RUM can also provide direct correlation to AppDynamics APM agents to combine the ‘front-end’ and ‘back-end’ of these user sessions where Salesforce may traverse additional down-stream applications and infrastructure.

Why JDS?

As experts in Application Performance Management (APM) and Observability, JDS have extensive experience in helping our customers determine the root cause of performance issues.

Contact us at [email protected] to discuss how monitoring Salesforce can be used to understand your end users and make informed decisions with quantifiable metrics. 

ServiceNow & ReactJS

Technology Background

Like any enterprise platform, ServiceNow has a complex relationship with its underlying architecture. Originally, ServiceNow was built on Java using Jelly XML for server-side component rendering. For its time, this approach was cutting edge.

As the Internet matured and social media ramped up, Google developed a clever client/server binding language called AngularJS that allowed for dynamic HTML pages to be rendered. ServiceNow adopted this only to have Google discontinue AngularJS in its original form. ServiceNow’s implementation of AngularJS as found in the Service Portal is world-class, but unfortunately, the underlying technology is no longer actively supported.

At this point, the architects at ServiceNow sat back and took a long hard look at emerging technologies and trends among the tech giants. It would be fair to say they were once bitten, twice shy. In developing their Agent Workspace UI, ServiceNow settled on using ReactJS (with GraphQL for data management) because of its broad scale adoption across the industry.

ReactJS is used by Facebook, Instagram, Netflix, WhatsApp and Dropbox to name a few, so ServiceNow are on safe ground with this technology.

Implementing ReactJS In ServiceNow

Whereas with AngularJS, ServiceNow provided an online IDE for widget development, at the moment the only way to build a ReactJS application for ServiceNow is to work offline. Once built, your ReactJS file can be deployed to ServiceNow as a packaged application.

There are pros and cons to this approach. On the positive side, ReactJS applications can be deployed with little to no overhead from ServiceNow, making them astonishingly fast and scalable. The only con is you need your own Node JS environment and ReactJS development platform.

Why Use ReactJS?

Why would anyone develop a ServiceNow application with ReactJS?

The answer is:

• ReactJS is an industry standard and so there is a vast pool of experienced web developers to draw upon
• ServiceNow provides a highly-scalable platform for ReactJS
• ServiceNow has built-in granular data security and APIs to manage data access
• ServiceNow is extremely efficient at workflow management and integration supporting ReactJS

Rather than building and managing a full-stack service platform for a ReactJS app, your app can be deployed quickly and easily through ServiceNow. Given the amount of effort and due-diligence required to operate a full-stack service at an enterprise level, ServiceNow provides a convenient shortcut.

When it comes to ReactJS, ServiceNow is effectively operating as PaaS (Platform as a Service). Think of your ReactJS app as a beautifully designed architectural home. ServiceNow allows you to position it as a penthouse suite without the need to worry about the rest of the building beneath it.

Creating A ReactJS Application

We’re going to create a nice simple ReactJS application listing contact details.

I recommend using the Code Sandbox for ReactJS applications as it is easy to use and provides an instant preview of your work.

To keep things simple, I’m going to use the ServiceNow REST API for Tables as my data access point.

Once you’ve signed into the Code Sandbox you’ll be assigned to one of their temporary virtual servers. The first time you run the code below it will fail because of cross-origin resource sharing restrictions (CORS).

If you look at the console log, you’ll find your temporary virtual server name. From there, you can set up a CORS exception that will allow access to your instance. Once that is in place, the application will work properly.

Without getting into too much detail, about how ReactJS works, we’re going to set up two files, our core Apps.js and contacts.js. We’re going to create a new folder called components to hold our contacts.js template.

Notice how when I hover over the line src folder in the Code Sandbox I get options for a new directory and a new file. This is how I added /components/contacts.js

Let’s look at the code used to retrieve contacts from ServiceNow and display them using ReactJS.

App.js

import React, { Component } from "react";
import Contacts from "./components/contacts";

class App extends Component {
  render() {
    return <Contacts contacts={this.state.contacts} />;
  }

  state = {
    contacts: []
  };

  componentDidMount() {   
    //this is a sample web service you can test with
    //fetch('https://jsonplaceholder.typicode.com/users',{
    fetch(
      "https://{your-instance}.service-now.com/api/now/table/sys_user?sysparm_query=emailENDSWITH{your-email-suffix}",
      {
        withCredentials: true,
        credentials: "include"
      }
    )
      .then((res) => res.json())
      .then((data) => {
        console.log(data);
        this.setState({ contacts: data.result });
      })
      .catch(console.log);
  }
}

export default App;

As you can see, our Apps.js file refers to /components/contacts to get an HTML/ReactJS template. It also includes a simple REST call (fetch) that uses the ServiceNow Table API to retrieve information from ServiceNow.

To get this example to work, you’ll have to replace…

  • {your-instance} with your ServiceNow instance name
  • {your-email-suffix} with your organisation’s email suffix (ie, gmail.com, etc)


contact.js is our HTML/ReactJS template. It takes the data retrieved from the fetch and formats it for display. It’s pretty straight-forward and intuitive to read.

contact.js

import React from "react";

const Contacts = ({ contacts }) => {
  return (
    <div>
      <center>
        <h1>Contact List</h1>
      </center>
      {contacts.map((contact) => (
        <div class="card">
          <div class="card-body">
            <h4 class="card-title">{contact.name}</h4>
            <h5 class="card-subtitle mb-2 text-muted">
              Email: {contact.email}
            </h5>
            <h6 class="card-text">UserID: {contact.user_name}</h6>
          </div>
        </div>
      ))}
    </div>
  );
};

export default Contacts;

That’s it.

That’s a ReactJS application.

At this point, your ReactJS application should work. If it doesn’t, look carefully at the console log in your browser and check you’ve completed the steps listed above.

Deploying A ReactJS Application

ReactJS applications need to be packaged and deployed.

Code Sandbox integrates with Netlify to provide online packaging and deployment.

The deployment may take a few minutes.

Make sure you have a Netlify account (I use my GitHub account for all of these services so everything is centralized)

Once you’ve signed into Netlify, Click on the little download arrow to get your package ready for deployment to ServiceNow.

Deploying on ServiceNow is simple enough, but it is a little bit of a hack.

This advice may change over time as ServiceNow develops its offering further, but the sanctioned approach at the moment is to deploy ReactJS as stylesheets.

The reason for this is style sheets are resources that can be accessed without authentication. In essence, you separate your JS and CSS into different stylesheets and then reference them from an HTML page (such as a UI page or a portal widget). So long as ReactJS is listed as a dependency for that page, it’ll load in the background, recognize your React JS in the stylesheet and run accordingly.

For more detail on ReactJS deployment in ServiceNow, please refer to:


Have fun and happy coding!

Performance Testing of Large Scale National Sales Event Website

Summary

JDS was engaged to performance test a National Sales Event at a very large scale in 2020. There are multiple events which happen throughout different periods of the year but this particular engagement was in preparation for the largest sales event of the year.

Test Scenario Approach and Modelling

Typical performance load tests would start off with a conservative ramp up followed by steady state. This can be seen in the image below.

This particular engagement called for a different kind of performance load test scenario which was very unique as it required two aggressive ramp ups across two different user groups (see image below).

The performance load test was also unlike any typical load tests as it required a large number of virtual users to be tested against (>100,000). Multiple approaches with available performance test tools were considered and the final call was to run the test via JMeter as it was cost effective and lightweight in terms of load generation resource utilisation.

Load Generation Infrastructure Approach

Load generator infrastructure was created via AWS EC2 as this allowed quick stand up and stand down of infrastructure which would allow easier management of load gen infrastructure cost.

One key approach to testing especially with the AWS load gen infrastructure was to test the load in increments. This allowed testing to be done in batches with different levels of load instead of trying to attempt the full load at the first or second attempt. By doing this, the cost of standing up and managing the load generation infrastructure will be much less.

Findings

During initial testing with a smaller load footprint, a performance bottleneck was identified. At about 1% of the expected load it was found that there was an issue when it came to user sign in. Users were then not allowed to log in and were thrown off the site. If this had happen during Go Live, the business would lose out on potential customers and the user confidence of the website would suffer and result in less customers in the future.

Once that was resolved it was also noted that response time performance across the client website improved once the application servers warmed up once load was introduced and further dropped when auto-scaling on the environment was triggered with the ramp up of load.

Server warm up can easily be executed prior to the site actually going live by introducing some artificial load on the live production site. This was something that the client had confirmed was already in place.

To learn more, contact our team today on 1300 780 432, or email [email protected].

Virtual Agent Is Your Friend

Don’t underestimate the importance of user satisfaction

If there’s one defining characteristic of the social media revolution it’s “make life easy.”

Why did Facebook win out over MySpace? Facebook made it easy to connect, easy to post, easy to find people, easy to interact.

Amazon, Google, Twitter and Facebook have spent the last decade refining their technology to lower the barrier-to-entry for users, making their web applications highly accessible. Have you ever wondered why Google only shows the first ten entries for each search when it could show twenty, fifty or a hundred? Google found that 10 results returned in 0.4 sec, while 30 results took 0.9 sec, but that extra half a second lead to a loss of 20% of their traffic because users were impatient. User satisfaction is the golden rule of online services and so 10 results per page is now standard across all search engines regardless even though now days the difference is probably much less.

When it comes to ServiceNow, organisations should focus on user satisfaction as a way of increasing productivity. ServiceNow allows organisations to treat both their internal staff and their customers with respect, offering services that are snappy, intelligent and well designed. To this end, ServiceNow has developed a number of offerings including Virtual Agent.

What is Virtual Agent?

To say Virtual Agent is a chat-bot is disingenuous. Virtual Agent is a channel for users to quickly and easy get answers to their questions. It is a state-of-the-art system that leverages Natural Language Understanding (NLU) and a complex, decision-based response engine to meet a user’s expectations without wasting their time.

The Natural Language Understanding machine learning engine used by ServiceNow is trained to understand conversational chats using Wikipedia and The Washington Post, and can be enhanced with organisational specific words and phrases. Natural Language Understanding is the gateway for users to reach a catalogue of prebuilt workflows that resolve common issues.

The Virtual Agent Designer allows for sophisticated workflows with complex decision-making. Not only does this reduce the burden on first-level support it drastically reduces the resolution time for common issues, raising the satisfaction of users with the services provided by your organisation.

But the real genius behind Virtual Agent is it can be run from ANYWHERE

A common problem experienced by organisations with ServiceNow is managing multiple corporate websites. The ServiceNow self-service portal can be seen by some users as yet another corporate web instance and a bridge too far, reducing the adoption of self-service. To combat this, ServiceNow allows its Virtual Agent to be deployed ANYWHERE. As an example, it’s on this WordPress page! Go ahead, give it a try. As soon as you click on “chat”, you’re interacting with the JDSAustraliaDemo1 instance of ServiceNow!

By allowing the Virtual Agent to run from anywhere, customers can incorporate ServiceNow functionality into their other websites, giving users easy access to the services and offerings available through ServiceNow.

Keep your users happy. Start using Virtual Agent.

Using Common Functions in the Service Catalog

ServiceNow’s service portal offers a lot of flexibility for customers wanting to offer complex and sophisticated offerings to their users. Catalog client scripts can run on load, on change and on submit, but often there’s a need for a common library of functions to be shared by these scripts (so they’re maintained in just one place and produce consistent results).

For example, in this case, if the start date, end date or the SAP position changes, the same script needs to run to calculate who the approvers are for a particular request.

Rather than having three separate versions of the same script, we want to be able to store our logic in one place. Here’s how we can do it.


Isolate Script

Although the latest versions of ServiceNow (London, Madrid, etc) allow for scripts to be isolated or not, giving ServiceNow admins either the option of protecting (isolating) their scripts or accessing broader libraries, in practice, this can be a little frustrating to implement, so in our example, we’ll use an alternative method to introduce external javascript libraries.


UI Scripts

UI scripts, like the one listed below, are very powerful, but they’re also very broad, being applied EVERYWHERE and ALWAYS, so we’ll tread lightly and simply add a function that sets up the DOM for access from our client scripts.

As you can see, we now have some variables we can reference to give us access to the document object, the window object and the angular object from anywhere within ServiceNow.

In theory, we could attach our SAP position changes script here and it would be accessible but it would also be loaded on EVERY page ServiceNow ever loads, which is not good. What we want is a global function accessible only from WITHIN our catalog item, so we’ll put this in an ON LOAD script using our new myWindow object.

The format we’re using is…

myWindow.functionName = function(){

console.log('this is an example')

};

This function can then be called from ANYWHERE within our catalog item (on change or on submit). Also, notice the semi-colon at the end of the window function. Don’t forget this as it is important as we’re altering an object.

Now, though, any time we want to call that common function, we can do so with a single line of code.


Following this approach makes maintenance of the logic used by the approval process easy to find and alter going forward.

Conclusion

To learn more about how JDS can optimize the performance of ServiceNow, contact our team today on 1300 780 432, or email [email protected].

Finding Exoplanets with Splunk

Splunk is a software platform designed to search, analyze and visualize machine-generated data, making sense of what, to most of us, looks like chaos.

Ordinarily, the machine data used by Splunk is gathered from websites, applications, servers, network equipment, sensors, IoT (internet-of-things) devices, etc, but there’s no limit to the complexity of data Splunk can consume.

Splunk specializes in Big Data, so why not use it to search the biggest data of all and find exoplanets?

What is an exoplanet?

An exoplanet is a planet in orbit around another star.

The first confirmed exoplanet was discovered in 1995 orbiting the star 51 Pegasi, which makes this an exciting new, emerging field of astronomy. Since then, Earth-based and space-based telescopes such as Kepler have been used to detect thousands of planets around other stars.

At first, the only planets we found were super-hot Jupiters, enormous gas giants orbiting close to their host stars. As techniques have been refined, thousands of exoplanets have been discovered at all sizes and out to distances comparable with planets in our own solar system. We have even discovered exomoons!


How do you find an exoplanet?

Imagine standing on stage at a rock concert, peering toward the back of the auditorium, staring straight at one of the spotlights. Now, try to figure out when a mosquito flies past that blinding light. In essence, that’s what telescopes like NASA’s TESS (Transiting Exoplanet Survey Satellite) are doing.

The dip in starlight intensity can be just a fraction of a percent, but it’s enough to signal that a planet is transiting the star.

Transits have been observed for hundreds of years in one form or another, but only recently has this idea been applied outside our solar system.

Australia has a long history of human exploration, starting some 60,000 years ago. In 1769 after (the then) Lieutenant James Cook sailed to Tahiti to observe the transit of Venus across the face of the our closest star, the Sun, he was ordered to begin a new search for the Great Southern Land which we know as Australia. Cook’s observation of the transit of Venus used largely the same technique as NASA’s Hubble, Kepler and TESS space telescopes but on a much simpler scale.

Our ability to monitor planetary transits has improved considerably since the 1700s.

NASA’s TESS orbiting telescope can cover an area 400 times as broad as NASA’s Kepler space telescope and is capable of monitoring a wider range of star types than Kepler, so we are on the verge of finding tens of thousands of exoplanets, some of which may contain life!

How can we use Splunk to find an exoplanet?

 Science thrives on open data.

All the raw information captured by both Earth-based and space-based telescopes like TESS are publicly available, but there’s a mountain of data to sift through and it’s difficult to spot needles in this celestial haystack, making this an ideal problem for Splunk to solve.

While playing with this over Christmas, I used the NASA Exoplanet Archive, and specifically the PhotoMetric data containing 642 light curves to look for exoplanets. I used wget in Linux to retrieve the raw data as text files, but it is possible to retrieve this data via web services.

MAST, the Mikulski Archive for Space Telescopes, has made available a web API that allows up to 500,000 records to be retrieved at a time using JSON format, making the data even more accessible to Splunk.

Some examples of API queries that can be run against the MAST are:

The raw data for a given observation appears as:

Information from the various telescopes does differ in format and structure, but it’s all stored in text files that can be interrogated by Splunk.

Values like the name of the star (in this case, Gliese 436) are identified in the header, while dates are stored either using HJD (Heliocentric Julian Dates) or BJD (Barycentric Julian Dates) centering on the Sun (with a difference of only 4 seconds between them).

Some observatories will use MJD which is the Modified Julian Date (being the Julian Date minus 2,400,000.5 which equates to November 17, 1858). Sounds complicated, but MJD is an attempt to simplify date calculations.

Think of HJD, BJD and MJD like UTC but for the entire solar system.

One of the challenges faced in gathering this data is that the column metadata is split over three lines, with the title, the data type and the measurement unit all appearing on separate lines.

The actual data captured by the telescope doesn’t start being displayed until line 138 (and this changes from file to file as various telescopes and observation sets have different amounts of associated metadata).

In this example, our columns are…

  • HJD - which is expressed as days, with the values beyond the decimal point being the fraction of that day when the observation occurred
  • Normalized Flux - which is the apparent brightness of the star
  • Normalized Flux Uncertainty - capturing any potential anomalies detected during the collection process that might cast doubt on the result (so long as this is insignificant it can be ignored).

Heliocentric Julian Dates (HJD) are measured from noon (instead of midnight) on 1 January 4713 BC and are represented by numbers into the millions, like 2,455,059.6261813 where the integer is the days elapsed since then, while the decimal fraction is the portion of the day. With a ratio of 0.00001 to 0.864 seconds, multiplying the fraction by 86400 will give us the seconds elapsed since noon on any given Julian Day. Confused? Well, your computer won’t be as it loves working in decimals and fractions, so although this system may seem counterintuitive, it makes date calculations simple math.

We can reverse engineer Epoch dates and regular dates from HJD/BJD, giving Splunk something to work with other than obscure heliocentric dates.

  • As Julian Dates start at noon rather than midnight, all our calculations are shifted by half a day to align with Epoch (Unix time)
  • The Julian date for the start of Epoch on CE 1970 January 1st 00:00:00.0 UT is 2440587.500000
  • Any-Julian-Date-minus-Epoch = 2455059.6261813 - 2440587.5 = 14472.12618
  • Epoch-Day = floor(Any-Julian-Date-minus-Epoch) * milliseconds-in-a-day = 14472 * 86400000 = 1250380800000
  • Epoch-Time = floor((Any-Julian-Date-minus-Epoch – floor(Any-Julian-Date-minus-Epoch)) * milliseconds-in-a-day = floor(0. 6261813 * 86400000) = 10902064
  • Observation-Epoch-Day-Time = Epoch-Day + Epoch-Time = 1250380800000 + 10902064 = 1250391702064

That might seem a little convoluted, but we now have a way of translating astronomical date/times into something Splunk can understand.

I added a bunch of date calculations like this to my props.conf file so dates would appear more naturally within Splunk.

[exoplanets]

SHOULD_LINEMERGE = false

LINE_BREAKER = ([\r\n]+)

EVAL-exo_observation_epoch = ((FLOOR(exo_HJD - 2440587.5) * 86400000) + FLOOR(((exo_HJD - 2440587.5) - FLOOR(exo_HJD - 2440587.5))  *  86400000))

EVAL-exo_observation_date = (strftime(((FLOOR(exo_HJD - 2440587.5) * 86400000) + FLOOR(((exo_HJD - 2440587.5) - FLOOR(exo_HJD - 2440587.5))  *  86400000)) / 1000,"%d/%m/%Y %H:%M:%S.%3N"))

EVAL-_time = strptime((strftime(((FLOOR(exo_HJD - 2440587.5) * 86400000) + FLOOR(((exo_HJD - 2440587.5) - FLOOR(exo_HJD - 2440587.5))  *  86400000)) / 1000,"%d/%m/%Y %H:%M:%S.%3N")),"%d/%m/%Y %H:%M:%S.%3N")

Once date conversions are in place, we can start crafting queries that map the relative flux of a star and allow us to observe exoplanets in another solar system.

Let’s look at a star with the unassuming ID 0300059.

sourcetype=exoplanets host="0300059"

| rex field=_raw "\s+(?P<exo_HJD>24\d+.\d+)\s+(?P<exo_flux>[-]?\d+.\d+)\s+(?P<exo_flux_uncertainty>[-]?\d+.\d+)" | timechart span=1s avg(exo_flux)

And there it is… an exoplanet blotting out a small fraction of starlight as it passes between us and its host star!

What about us?

While curating the Twitter account @RealScientists, Dr. Jessie Christiansen made the point that we only see planets transit stars like this if they’re orbiting on the same plane we’re observing. She also pointed out that “if you were an alien civilization looking at our solar system, and you were lined up just right, every 365 days you would see a (very tiny! 0.01%!!) dip in the brightness that would last for 10 hours or so. That would be Earth!”

There have even been direct observations of planets in orbit around stars, looking down from above (or up from beneath depending on your vantage point). With the next generation of space telescopes, like the James Webb, we’ll be able to see these in greater detail.


Image credit: NASA exoplanet exploration

Next steps

From here, the sky’s the limit—quite literally.

Now we’ve brought data into Splunk we can begin to examine trends over time.

Astronomy is BIG DATA in all caps. The Square Kilometer Array (SKA), which comes on line in 2020, will create more data each day than is produced on the Internet in a year!

Astronomical data is the biggest of the Big Data sets and that poses a problem for scientists. There’s so much data it is impossible to mine it all thoroughly. This has led to the emergence of citizen science, where regular people can contribute to scientific discoveries using tools like Splunk.

Most stars have multiple planets, so some complex math is required to distinguish between them, looking at the frequency, magnitude and duration of their transits to identify them individually. Over the course of billions of years, the motion of planets around a star fall into a pattern known as orbital resonance, which is something that can be predicted and tested by Splunk to distinguish between planets and even be used to predict undetected planets!

Then there’s the tantalizing possibility of exomoons orbiting exoplanets. These moons would appear as a slight dip in the transit line (similar to what’s seen above at the end of the exoplanet’s transit). But confirming the existence of an exomoon relies on repeated observations, clearly distinguished from the motion of other planets around that star. Once isolated, the transit lines should show a dip in different locations for different transits (revealing how the exomoon is swinging out to the side of the planet and increasing the amount of light being blocked at that point).

Given its strength with modelling data, predictive analytics and machine learning, Splunk is an ideal platform to support the search for exoplanets.

Find out more

If you’d like to learn more about how Splunk can help your organization reach for the stars, contact one of our account managers.

Our team on the case

Our Splunk stories

Glide Variables

ServiceNow uses a special type of super flexible variable to store information in what appears like a single field, but is actually a complex storage/management system with a database column type called glide_var.As each record can have a different number of variables stored as key/value pairs, there’s no easy way of dot-walking to the name of the variable within the glide_var as the names can change from record to record within the same table! You can, however, detect and retrieve variables from a glide_var by treating the gliderecord field as an object.

In this example, from an automated test framework step, you can see each of the variables and their values from the database glide_var column inputs.

var gr = new GlideRecord('the table you are looking at')
gr.get('sys_id of the record you are looking at')

for(var eachVariable in gr.inputs){
gs.info(eachVariable + ' : ' + gr.inputs[eachVariable])
}

If you run this in a background script you’ll see precisely which variables exist and what their values are.

It doesn’t need to be complicated! Reach out to us and we can help you.

Governance, Risk & Compliance

ServiceNow has implemented Governance, Risk and Compliance (GRC) based on the OCEG (Open Compliance & Ethics Group) GRP Capability Model.

What is GRC?

  • Governance allows an organisation to reliably achieve its objectives
  • Risk addresses uncertainty in a structured manner
  • Compliance ensures business activities are undertaken with integrity

Whether organisations formally recognize GRC or not, they all need to undertake some form of governance over their business activities or they will not be able to reliably achieve their goals.

When it comes to risk, recognising and addressing uncertainty ensures the durability of an organisation before it is placed in a position where it is under stress. Public and government expectations are that organisations will act with integrity; failure to do so may result in a loss of revenue, loss of social standing and possibly government fines or loss of licensing.

Governance, Risk and Compliance is built around the authority documents, policies and risks identified by the organisation as important.

Depending on the industry, there are a number of standards authorities and government regulations that form the basis for documents of authority, providing specific compliance regulations. ISO (the International Organisation for Standardization) has established quality assurance standards such as ISO 9000, and risk management frameworks such as ISO 31000, or ISO 27000 standards for information security management.

In addition to these, various governments may demand adherence to standards developed to protect the public, such as Sarbanes-Oxley (to protect investors against possible fraud), HIPAA (the US Health Insurance Portability and Accountability Act of 1996) and GDPR (the European Union’s General Data Protection Regulation). ServiceNow’s GRC allows organisations to manage these complex requirements and ensure they are compliant and operating efficiently.

The sheer number of documents and standards, along with the complexity of how they depend on and interact with each other, can make GRC daunting to administer. ServiceNow has simplified this process by structuring these activities in a logical framework.

Authority documents (like ISO 27000), internal policies and risk frameworks (like ISO 31000) represent a corporate library—the ideal state for the organisation. The question then becomes, how well does an organisation measure up to its ideals in terms of policies and risks?

ServiceNow addresses this by using profile types.

Profile types are a means of translating polices and risks into practice.

When policy types are applied to policy statements, they form the active controls for an organisation— that is, those controls from the library that are being actively monitored.

In the same way, when risks are applied to policy types, they form the risk register for the organization. This is the definitive list of those specific risks that are being actively measured and monitored, as opposed to all risks.

This approach allows organisations to accurately measure their governance model and understand which areas they need to focus on to improve.

The metrics supporting GRC profile types can be gathered manually via audit-styled surveys of employees and third-parties, or in an automated fashion using information stored elsewhere within ServiceNow (such as IT Service Management or Human Resources). In addition to this, GRC compliance metrics for the various profile types can be gathered using orchestration and automation, and by integrating with other systems to provide an accurate view of governance, risk and compliance.

If you would like to learn more about how ServiceNow can support your organisation manage the complexity of GRC, please speak to one of our account executives.

Conclusion

It doesn’t need to be complicated! Reach out to us and we can help you manage your organizational risks.

Asset Management in ServiceNow

Effective ICT departments are increasingly reliant on solid software and hardware asset management, yet the concept can often strike fear into the hearts of organisations as the complexity and work involved can seem endless. Indeed, Asset Management can be like trying to reach the moon with a step ladder! New advances in ServiceNow seek to change that ladder into a rocket - here’s how.


Business Goals (Launch Pad): Truly understanding your business goals and processes is an important and often underrated start to successful asset management. Clarifying business requirements allows us here at JDS to recommend suitable approaches to customers and help realise benefits faster. A recurring challenge we address is reducing unnecessary costs in over-licensed software. Through the power of ServiceNow technology, we can help you automate the removal and management of licenses.

Accurate Data (Rocket Fuel): Accurate data is the fuel behind asset management. With asset data commonly scattered across multiple systems, trusted data sources are paramount; often with organisations reliant on these to track and extract information for reports and often crucial decisions. JDS is experienced in tools such as ServiceNow Discovery and integrations with third-party providers like MicroFocus uCMDB, Microsoft SCCM and Ivanti LANDESK – proven solutions to assist management teams with data for business strategy.Using ServiceNow, we can help plan data imports/transformations to ensure information is accurate. This means asset info can be normalised automatically to improve data quality and ensure accurate reporting.


Asset Management on ServiceNow (Rocket Engine): With clear business goals and a focus on accurate data, ServiceNow also has further capabilities to propel your asset management process. Customers can now manage the lifecycle of asset management with refined expertise. JDS are champions of this automation process, particularly as proven benefits include streamlining and having an entire lifecycle consolidated and managed from one location, to greatly improve visibility and overall management.


Ongoing Management (Control Panel): With robust asset management now implemented, customers need a suitable control panel to help maintain momentum and drive continuous process improvement. Utilising a mix of existing ServiceNow and customised reports and dashboards, organisations are now able to easily digest data like never before.

Example of Software Asset Management

Example of Hardware Asset Management

Our team here are experienced in assisting customers setup ongoing asset reviews and audits on these platforms. One example of how we’ve customised this process, is by automating regular asset stocktake tasks, which can then be monitored and reported on the ServiceNow platform.

Conclusion

Successful Asset Management can be a journey, yet well worth the effort by significantly improving on processes and reducing operational costs. Our team are experts in devising solutions with customers, to realise and maximise the value of efficient asset management; and help firmly plant your organisation’s foot and flag on the moon!

Conclusion

Need help in planning and implementing a robust asset management solution? Reach out to us with your current challenges, we would love to help.

Fast-track ServiceNow upgrades with Automated Testing Framework (ATF)

Why automate?

ServiceNow provides two releases a year, delivering new features to consistently support best practice processes. ServiceNow has flagged they will move towards “N-1” upgrades in 2019, meaning every customer will need to accept each release in the future. To keep up, ServiceNow customers should consider automated testing. This can provide regression testing, completed consistently for each release, and reduce the time and effort needed per upgrade. Effective test automation on ServiceNow is provided by the Automated Testing Framework (ATF), which is included in the ServiceNow platform for all applications. It enables no-code and low-code users to create automated tests with ease. Aided by complementary processes and methodology, ATF reduces upgrade pain by cutting back on manual tests, reducing business impact and accelerating development efficiency.

What is the Automated Test Framework?

Testing frameworks can be viewed as a set of guidelines used for creating and designing test cases. Test automation frameworks take this a step further by using a range of automation tools designed to make the practice of quality assurance more manageable for testing teams.

ServiceNow’s ATF application combines the above into an easy to use and implement solution specifically for ServiceNow applications and functionality. Think of ATF as a tool to streamline your upgrade and QA processes by building tests to check if software or configuration changes have potentially ‘broken’ any existing functionality. It also means developers would no longer be required to start invasive activities like code refactoring to generate new test cases.

Overview of test creation in ServiceNow ATF - click to enlarge

ATF’s unique features include:

  • Codeless setup of test steps and templates (reusable across multiple tests)
  • Testing Service Catalog from end-to-end including submitting Catalog forms and request fulfilment
  • Module testing e.g. ITSM (Incident, Problem & Change Management)
  • Testing forms in the Service Portal (Included in London release)
  • Batching with test suites e.g. Execute multiple tests in a defined order and trigger based on a schedule
  • Custom step configurations & unit testing using the Jasmine test framework
       

Using the codeless test step configuration in ATF to set a Variable value on a Service Catalog form

Simplify your upgrades

For most software upgrades, testing is a burdensome and complicated process, with poorly defined test practices often leading to compromised software quality and potentially, failed projects. Without automation, teams are forced to manually test upgrades - a costly, time-consuming and often ineffective exercise. In most cases, this can be attributed to a lack of testing resources and missing test processes, leading to inconsistent execution.

To address these, ATF introduces structure and enforces consistency across different tests applied to common ServiceNow use cases. Test consistency is important, as this forms a baseline of instance stability based on existing issues, meaning defects caused by upgrades are more reliably determined. ATF allows for full automation of test suites, where the run order can be configured based on tests that depend on each other.  

The following illustrates a simple test dependency created in ATF:

An example ‘hierarchical’ test structure implemented within ATF

A common issue resolved by automated testing is the impact on Agile development cycles. Traditionally, developers would run unit tests by hand, based on steps also written by the developer, potentially leading to missed steps and incomplete scenarios. ATF can be used to run automated unit tests between each build cycle, saving time through early detection and remediation of software issues along with shortened development cycles. The fewer issues present before the upgrade, the fewer issues introduced during the upgrade.

A common requirement of post-upgrade activities is to execute a full regression test against the platform. This means accounting for countless business logic, client scripts, UI policies and web forms that may have been affected. Rather than factoring all of these scenarios into lengthy UAT/Regression cycles, ATF can reduce the load on the business by running those common and repetitive test cases involving multiple user interactions and data entry.

The below example shows how a common use case for testing, field ‘state’ validation on a Service Portal form, is applied using the test step module:

Validating visible & mandatory states of variables with ATF against a Record Producer in Service Portal

Unfortunately, not everything can be automated with ATF out of the box, there are some gaps that are a result of complex UI components, portal widgets and custom development work. It is also important to note custom functionality will add overhead to the framework implementation, and will require specialised scripting knowledge and making use of the ‘Step Configurations’ module to create custom test steps.

When configured properly, it’s possible to automate between 40-60% of test cases with ATF depending on environment complexity and timeframes. The benefits can largely be seen during regression testing post-upgrade, and unit testing during development projects.

In summary, implementing an ATF is a great way of delivering value to ServiceNow upgrade projects and enabling development teams to be more agile. Assessing the scope and depth of testing using an agreed methodology is a great way to determine what is required, and to achieve ‘buy-in’ from others, rather than taking the ‘automate everything’ approach.

JDS is here to help

Recognised as experts in the local Test Automation space for over 12 years, JDS' specialist team has adapted this experience to provide a proven framework for ServiceNow ATF implementation.

We have developed a Rapid Automated Testing tool which can use your existing data to take up to 80% of the work out of building your automated tests. Contact us today to find out how we can build test cases based on real data and automate the development of your testing suite in a fraction of the time that manual test creation would require.

We can help you get started with ServiceNow ATF. In just a few days, a ServiceNow ATF “Kick Start” engagement will provide you with the detail you need to scope and plan ATF on your platform.

Conclusion

Want to know more? Email [email protected] or call 1300 780 432 to reach our team.

Our team on the case

Is DevPerfOps a thing?

New technology terms are constantly being coined. One of our lead consultants answers the question: Is DevPerfOps a thing?


Hopefully it’s no surprise that traditional performance testing has struggled to adapt to the new paradigm of DevOps, or even Agile. The problems can be boiled down to a few key factors:

  1. Performance testing takes time—time to script, and time to execute. A typical performance test engagement is 4-6 weeks, during which time the rest of the project team has made significant progress. 
  2. Introducing performance testing to a CI/CD pipeline is really challenging. Tests typically run for an hour or more and can hold up the pipeline, and they are extremely sensitive to application changes as the scripts operate at the protocol level (typically HTTP requests). 
  3. Performance testing often requires a full-sized, production-like infrastructure environment. These aren’t cheap and are normally unavailable during early development, making “early performance testing” more of an aspirational idea, rather than something that is always practical.

All the software vendors will tell you that DevOps with performance testing is easy, but none of them have solved the above problems. For the most part, they have simply added a CI/CD hook without even attempting to challenge the concept of performance testing in DevOps at all.

A new world

So what would redefining the concept of performance testing look like? Allow me to introduce DevPerfOps. We would define the four main activities of a DevPerfOps engineer as:

  1. Tactical Load Tests
  2. Microbenchmarking
  3. APM and Code Reviews
  4. Container Workloads

Let’s start at the top.

Tactical Load Testing

This is can be broadly defined as running performance tests within the limitations of a CD/CI pipeline. Is it perfect? No. Is it better than not doing anything or struggling with a full end-to-end test? Absolutely, yes!

Tactical Load Testing has the following objectives:

  • Leverage CI toolkits like Jenkins for execution and results collection.
  • Use lightweight toolsets for execution (JMeter, Taurus, Gatling, LoadRunner, etc. are all perfectly good choices).
  • Configure performance tests to run for short durations. 15-20 minutes is the ideal balance. This can be achieved by minimising the run logic, reducing think times, and focusing on only testing individual business processes.
  • Expect to run your performance tests on a scaled-down environment, or a single server node. Think about what this will do to your workload profile.

Microbenchmarking

These are mini unit or integration tests designed to ensure that a component operates within a performance benchmark and that deviations are detected.

Microbenchmarking can target things like core application code, SQL queries, and Web Service integrations. There is an enormous amount of potential scope here; for example, you can write a microbenchmark test for a login, or a report execution, or a data transformation--anything goes if it makes sense.

Most importantly, microbenchmarking is a great opportunity to test early in the project lifecycle and provide early feedback.

APM and Code Reviews

In past years, having access to a good APM tool or profiler, or even the source code, has been a luxury. Not anymore--these tools are everywhere, and while a fully featured tool like AppDynamics or New Relic is beneficial for developers and operations, a lot can be achieved with low-cost tools like YourKit Profiler or VisualVM.

APM or profilers allow slow execution paths to be identified, and memory usage and CPU utilisation to be measured. Resource intensive workloads can be easily identified and performance baked into the application.

Container Workloads

Containers will one day rule the world. If you don’t know much about containers, you need to learn about them fast.

In terms of performance engineering, each container handles a small unit of workload and container orchestration engines like Kubernetes will auto-scale that container horizontally across the entire data centre. It’s not uncommon for applications to run on hundreds or thousands of containers.

What’s important here is that the smallest unit of workload is tiny, and scaling is something that a well-designed application will get for free. This allows your performance tests to scale accordingly, and it allows the whole notion of “what is application infrastructure” to be challenged. In the container world, an application is a service definition… and the rest is handled for you.

So, is DevPerfOps a thing? We think so, and we think it will only continue to grow and expand from here. It’s time that performance testing meets the needs of 2018 IT teams, and JDS can help. If you have any questions or want to discuss more, please get in touch with our performance engineering team by emailing [email protected]. If you’re looking for a quick, simple way of getting actionable insights into the performance health of your website or application, check out our current One Second Faster promotion.

Our team on the case

Read more Tech Tips

Monitoring Atlassian Suite with AppDynamics

Millions of IT professionals use JIRA, Confluence, and Bitbucket daily as the backbone of their software lifecycle. These tools are critical to getting anything done in thousands of organisations. If you’re reading this, it’s safe to guess that’s the case for your organisation too!

Application monitoring is crucial when your business relies on good application performance. Just knowing that your application is running isn’t enough; you need assurance that it’s performing optimally. This is what a JDS client that runs in-house instances of JIRA, Confluence, and Bitbucket, recently found out.

This client, a major Australian bank, started to notice slowness with JIRA, but the standard infrastructure monitoring they were using was not providing enough insight to allow them to determine the root cause.

JDS was able to instrument their Atlassian products with AppDynamics APM agents to gain insights into the performance of the applications. After deployment of the Java Agents to the applications, AppDynamics automatically populated the topology map below, known as a Flow Map. This Flow Map shows the interactions for each application, accompanied by overall application and Business Transaction health, and metrics like load, response time, and errors.

After some investigation, we found the root cause of the JIRA slowness was some Memcached backends. Once we determined the root cause and resolved the issue, operational dashboards were created to help the Operations team monitor the Atlassian application suite. Below is a screenshot of a subsection of the dashboard showing Database Response Times, Cache Response Times, and Garbage Collection information.

An overview dashboard was also created to assist with monitoring across the suite. The Dashboard has been split out to show Slow, Very Slow, and Error percentages along with Average Response Times and Call Volumes for each application. Drilldowns were also added to take the user directly to the respective application Flow Map. Using these dashboards, they can, at a glance, check the overall application health for the Atlassian products. This has helped them improve the quality of service and user experience.

The bank’s JIRA users now suffer from far fewer slowdowns, particularly during morning peaks when many hurried story updates are taking place in time for stand-ups! The DevOps team is also able to get a heads-up from AppDynamics when slowness starts to occur, rather than when performance has fallen off a cliff.

So if you’re looking for more effective ways to monitor your Atlassian products, give our AppDynamics team a call. We can develop and implement a customised solution for your business to help ensure your applications run smoothly and at peak performance.

Our team on the case

Our AppDynamics stories