
Monitoring Atlassian Suite with AppDynamics

Millions of IT professionals use JIRA, Confluence, and Bitbucket daily as the backbone of their software lifecycle. These tools are critical to getting anything done in thousands of organisations. If you’re reading this, it’s safe to guess that’s the case for your organisation too!
Application monitoring is crucial when your business relies on good application performance. Just knowing that your application is running isn’t enough; you need assurance that it’s performing optimally. This is what a JDS client that runs in-house instances of JIRA, Confluence, and Bitbucket, recently found out.
This client, a major Australian bank, started to notice slowness with JIRA, but the standard infrastructure monitoring they were using was not providing enough insight to allow them to determine the root cause.
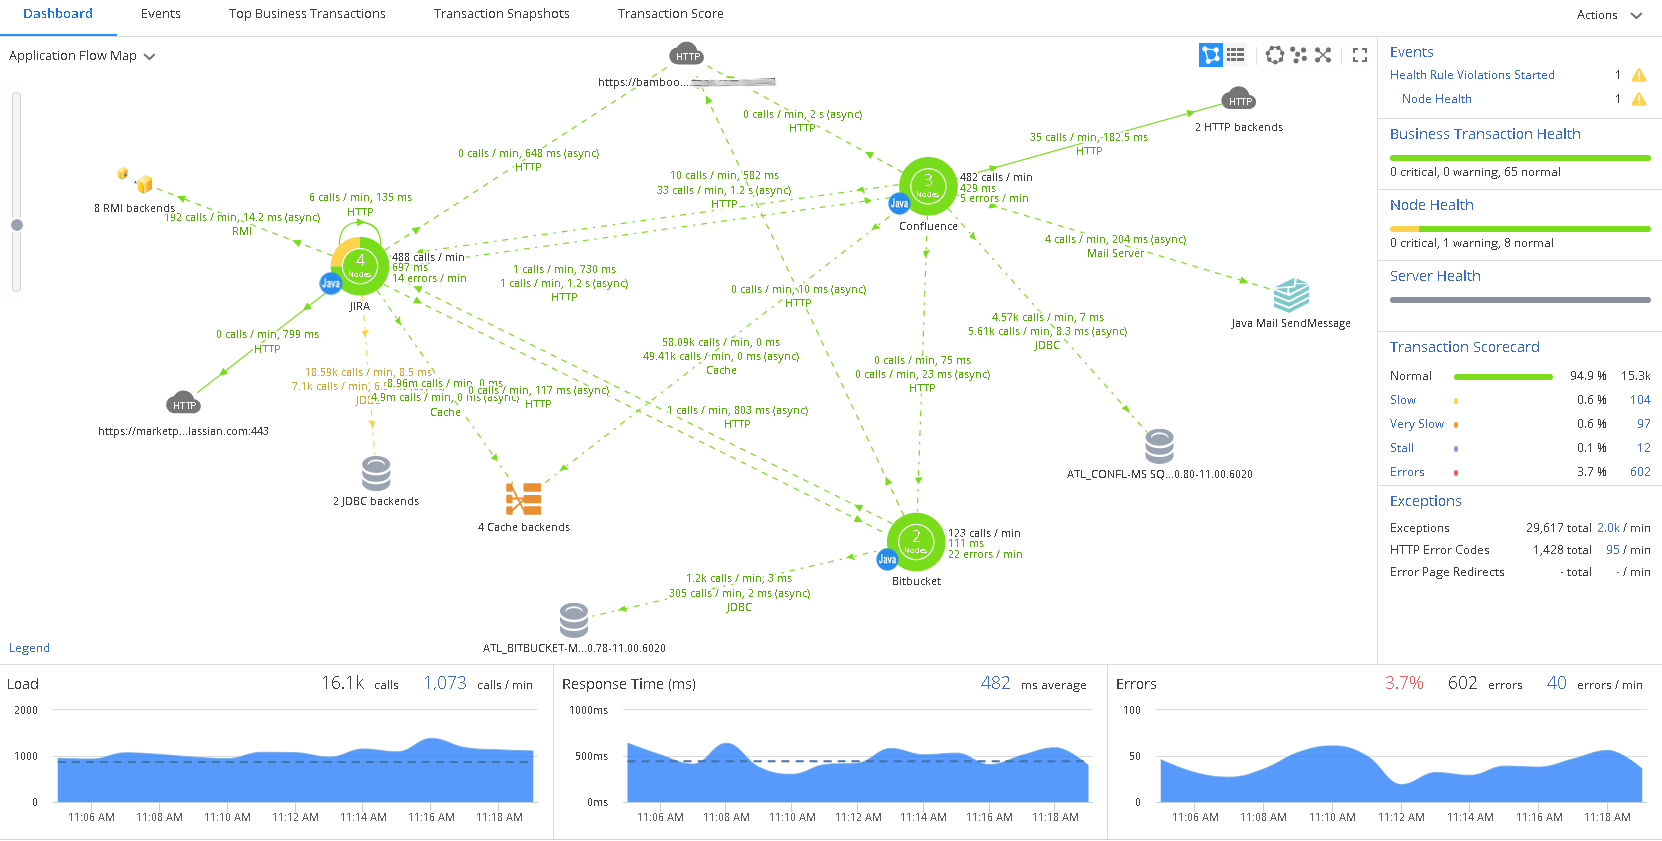
JDS was able to instrument their Atlassian products with AppDynamics APM agents to gain insights into the performance of the applications. After deployment of the Java Agents to the applications, AppDynamics automatically populated the topology map below, known as a Flow Map. This Flow Map shows the interactions for each application, accompanied by overall application and Business Transaction health, and metrics like load, response time, and errors.
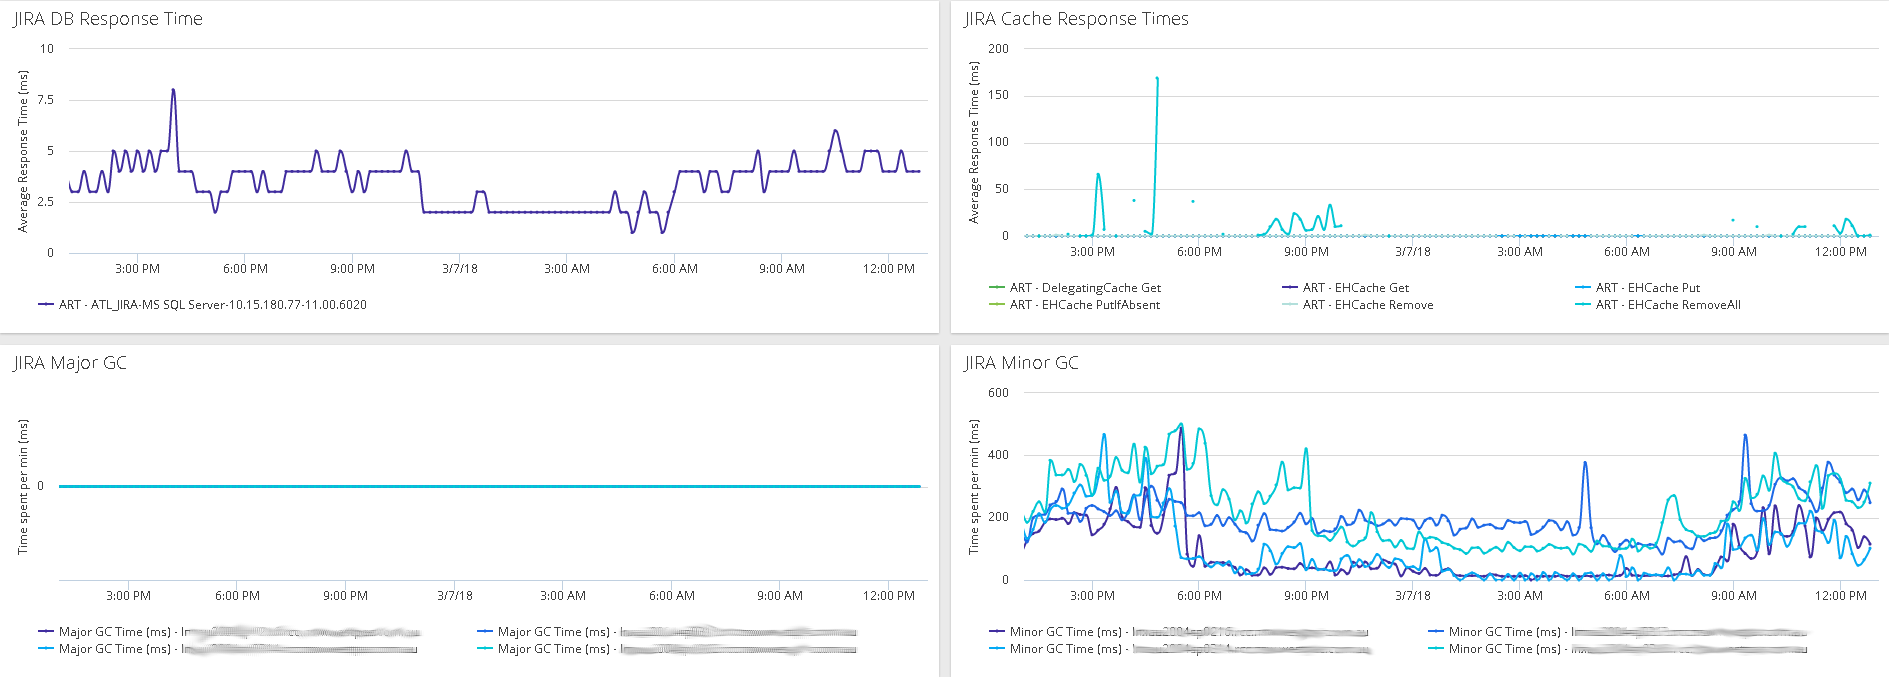
After some investigation, we found the root cause of the JIRA slowness was some Memcached backends. Once we determined the root cause and resolved the issue, operational dashboards were created to help the Operations team monitor the Atlassian application suite. Below is a screenshot of a subsection of the dashboard showing Database Response Times, Cache Response Times, and Garbage Collection information.
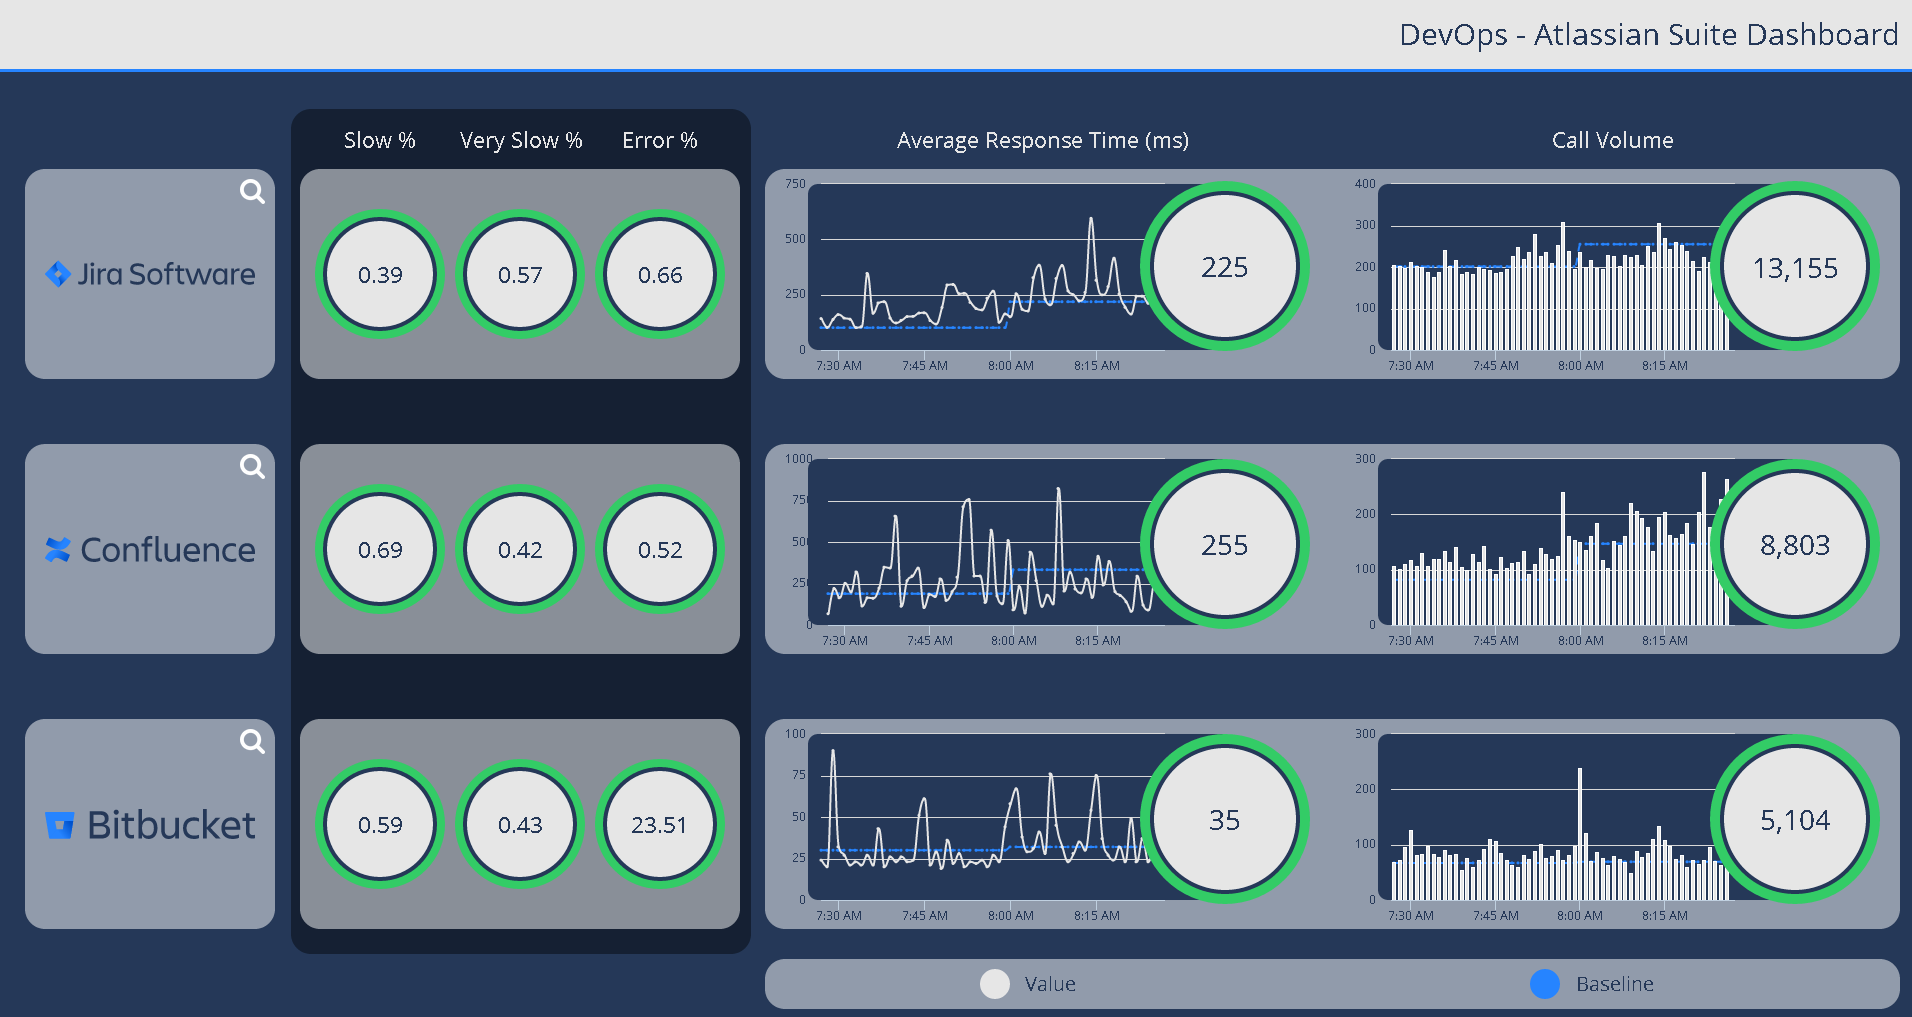
An overview dashboard was also created to assist with monitoring across the suite. The Dashboard has been split out to show Slow, Very Slow, and Error percentages along with Average Response Times and Call Volumes for each application. Drilldowns were also added to take the user directly to the respective application Flow Map. Using these dashboards, they can, at a glance, check the overall application health for the Atlassian products. This has helped them improve the quality of service and user experience.
The bank’s JIRA users now suffer from far fewer slowdowns, particularly during morning peaks when many hurried story updates are taking place in time for stand-ups! The DevOps team is also able to get a heads-up from AppDynamics when slowness starts to occur, rather than when performance has fallen off a cliff.
So if you’re looking for more effective ways to monitor your Atlassian products, give our AppDynamics team a call. We can develop and implement a customised solution for your business to help ensure your applications run smoothly and at peak performance.

One Platform. Full Stack. In Context

Four Exciting Takeaways from Cisco Live 2023

JDS and the GO Foundation

Understanding your Customer Journeys in Salesforce with AppDynamics
JDS Australia works with numerous customers who utilise the force.com platform as the primary interface for their end users ...
Monitoring Atlassian Suite with AppDynamics

JDS wins AppDynamics Partner Award