Author: JDS

Asset Management in ServiceNow

Effective ICT departments are increasingly reliant on solid software and hardware asset management, yet the concept can often strike fear into the hearts of organisations as the complexity and work involved can seem endless. Indeed, Asset Management can be like trying to reach the moon with a step ladder! New advances in ServiceNow seek to change that ladder into a rocket - here’s how.


Business Goals (Launch Pad): Truly understanding your business goals and processes is an important and often underrated start to successful asset management. Clarifying business requirements allows us here at JDS to recommend suitable approaches to customers and help realise benefits faster. A recurring challenge we address is reducing unnecessary costs in over-licensed software. Through the power of ServiceNow technology, we can help you automate the removal and management of licenses.

Accurate Data (Rocket Fuel): Accurate data is the fuel behind asset management. With asset data commonly scattered across multiple systems, trusted data sources are paramount; often with organisations reliant on these to track and extract information for reports and often crucial decisions. JDS is experienced in tools such as ServiceNow Discovery and integrations with third-party providers like MicroFocus uCMDB, Microsoft SCCM and Ivanti LANDESK – proven solutions to assist management teams with data for business strategy.Using ServiceNow, we can help plan data imports/transformations to ensure information is accurate. This means asset info can be normalised automatically to improve data quality and ensure accurate reporting.


Asset Management on ServiceNow (Rocket Engine): With clear business goals and a focus on accurate data, ServiceNow also has further capabilities to propel your asset management process. Customers can now manage the lifecycle of asset management with refined expertise. JDS are champions of this automation process, particularly as proven benefits include streamlining and having an entire lifecycle consolidated and managed from one location, to greatly improve visibility and overall management.


Ongoing Management (Control Panel): With robust asset management now implemented, customers need a suitable control panel to help maintain momentum and drive continuous process improvement. Utilising a mix of existing ServiceNow and customised reports and dashboards, organisations are now able to easily digest data like never before.

Example of Software Asset Management

Example of Hardware Asset Management

Our team here are experienced in assisting customers setup ongoing asset reviews and audits on these platforms. One example of how we’ve customised this process, is by automating regular asset stocktake tasks, which can then be monitored and reported on the ServiceNow platform.

Conclusion

Successful Asset Management can be a journey, yet well worth the effort by significantly improving on processes and reducing operational costs. Our team are experts in devising solutions with customers, to realise and maximise the value of efficient asset management; and help firmly plant your organisation’s foot and flag on the moon!

Conclusion

Need help in planning and implementing a robust asset management solution? Reach out to us with your current challenges, we would love to help.

Fast-track ServiceNow upgrades with Automated Testing Framework (ATF)

Why automate?

ServiceNow provides two releases a year, delivering new features to consistently support best practice processes. ServiceNow has flagged they will move towards “N-1” upgrades in 2019, meaning every customer will need to accept each release in the future. To keep up, ServiceNow customers should consider automated testing. This can provide regression testing, completed consistently for each release, and reduce the time and effort needed per upgrade. Effective test automation on ServiceNow is provided by the Automated Testing Framework (ATF), which is included in the ServiceNow platform for all applications. It enables no-code and low-code users to create automated tests with ease. Aided by complementary processes and methodology, ATF reduces upgrade pain by cutting back on manual tests, reducing business impact and accelerating development efficiency.

What is the Automated Test Framework?

Testing frameworks can be viewed as a set of guidelines used for creating and designing test cases. Test automation frameworks take this a step further by using a range of automation tools designed to make the practice of quality assurance more manageable for testing teams.

ServiceNow’s ATF application combines the above into an easy to use and implement solution specifically for ServiceNow applications and functionality. Think of ATF as a tool to streamline your upgrade and QA processes by building tests to check if software or configuration changes have potentially ‘broken’ any existing functionality. It also means developers would no longer be required to start invasive activities like code refactoring to generate new test cases.

Overview of test creation in ServiceNow ATF - click to enlarge

ATF’s unique features include:

  • Codeless setup of test steps and templates (reusable across multiple tests)
  • Testing Service Catalog from end-to-end including submitting Catalog forms and request fulfilment
  • Module testing e.g. ITSM (Incident, Problem & Change Management)
  • Testing forms in the Service Portal (Included in London release)
  • Batching with test suites e.g. Execute multiple tests in a defined order and trigger based on a schedule
  • Custom step configurations & unit testing using the Jasmine test framework
       

Using the codeless test step configuration in ATF to set a Variable value on a Service Catalog form

Simplify your upgrades

For most software upgrades, testing is a burdensome and complicated process, with poorly defined test practices often leading to compromised software quality and potentially, failed projects. Without automation, teams are forced to manually test upgrades - a costly, time-consuming and often ineffective exercise. In most cases, this can be attributed to a lack of testing resources and missing test processes, leading to inconsistent execution.

To address these, ATF introduces structure and enforces consistency across different tests applied to common ServiceNow use cases. Test consistency is important, as this forms a baseline of instance stability based on existing issues, meaning defects caused by upgrades are more reliably determined. ATF allows for full automation of test suites, where the run order can be configured based on tests that depend on each other.  

The following illustrates a simple test dependency created in ATF:

An example ‘hierarchical’ test structure implemented within ATF

A common issue resolved by automated testing is the impact on Agile development cycles. Traditionally, developers would run unit tests by hand, based on steps also written by the developer, potentially leading to missed steps and incomplete scenarios. ATF can be used to run automated unit tests between each build cycle, saving time through early detection and remediation of software issues along with shortened development cycles. The fewer issues present before the upgrade, the fewer issues introduced during the upgrade.

A common requirement of post-upgrade activities is to execute a full regression test against the platform. This means accounting for countless business logic, client scripts, UI policies and web forms that may have been affected. Rather than factoring all of these scenarios into lengthy UAT/Regression cycles, ATF can reduce the load on the business by running those common and repetitive test cases involving multiple user interactions and data entry.

The below example shows how a common use case for testing, field ‘state’ validation on a Service Portal form, is applied using the test step module:

Validating visible & mandatory states of variables with ATF against a Record Producer in Service Portal

Unfortunately, not everything can be automated with ATF out of the box, there are some gaps that are a result of complex UI components, portal widgets and custom development work. It is also important to note custom functionality will add overhead to the framework implementation, and will require specialised scripting knowledge and making use of the ‘Step Configurations’ module to create custom test steps.

When configured properly, it’s possible to automate between 40-60% of test cases with ATF depending on environment complexity and timeframes. The benefits can largely be seen during regression testing post-upgrade, and unit testing during development projects.

In summary, implementing an ATF is a great way of delivering value to ServiceNow upgrade projects and enabling development teams to be more agile. Assessing the scope and depth of testing using an agreed methodology is a great way to determine what is required, and to achieve ‘buy-in’ from others, rather than taking the ‘automate everything’ approach.

JDS is here to help

Recognised as experts in the local Test Automation space for over 12 years, JDS' specialist team has adapted this experience to provide a proven framework for ServiceNow ATF implementation.

We have developed a Rapid Automated Testing tool which can use your existing data to take up to 80% of the work out of building your automated tests. Contact us today to find out how we can build test cases based on real data and automate the development of your testing suite in a fraction of the time that manual test creation would require.

We can help you get started with ServiceNow ATF. In just a few days, a ServiceNow ATF “Kick Start” engagement will provide you with the detail you need to scope and plan ATF on your platform.

Conclusion

Want to know more? Email [email protected] or call 1300 780 432 to reach our team.

Our team on the case

Is DevPerfOps a thing?

New technology terms are constantly being coined. One of our lead consultants answers the question: Is DevPerfOps a thing?


Hopefully it’s no surprise that traditional performance testing has struggled to adapt to the new paradigm of DevOps, or even Agile. The problems can be boiled down to a few key factors:

  1. Performance testing takes time—time to script, and time to execute. A typical performance test engagement is 4-6 weeks, during which time the rest of the project team has made significant progress. 
  2. Introducing performance testing to a CI/CD pipeline is really challenging. Tests typically run for an hour or more and can hold up the pipeline, and they are extremely sensitive to application changes as the scripts operate at the protocol level (typically HTTP requests). 
  3. Performance testing often requires a full-sized, production-like infrastructure environment. These aren’t cheap and are normally unavailable during early development, making “early performance testing” more of an aspirational idea, rather than something that is always practical.

All the software vendors will tell you that DevOps with performance testing is easy, but none of them have solved the above problems. For the most part, they have simply added a CI/CD hook without even attempting to challenge the concept of performance testing in DevOps at all.

A new world

So what would redefining the concept of performance testing look like? Allow me to introduce DevPerfOps. We would define the four main activities of a DevPerfOps engineer as:

  1. Tactical Load Tests
  2. Microbenchmarking
  3. APM and Code Reviews
  4. Container Workloads

Let’s start at the top.

Tactical Load Testing

This is can be broadly defined as running performance tests within the limitations of a CD/CI pipeline. Is it perfect? No. Is it better than not doing anything or struggling with a full end-to-end test? Absolutely, yes!

Tactical Load Testing has the following objectives:

  • Leverage CI toolkits like Jenkins for execution and results collection.
  • Use lightweight toolsets for execution (JMeter, Taurus, Gatling, LoadRunner, etc. are all perfectly good choices).
  • Configure performance tests to run for short durations. 15-20 minutes is the ideal balance. This can be achieved by minimising the run logic, reducing think times, and focusing on only testing individual business processes.
  • Expect to run your performance tests on a scaled-down environment, or a single server node. Think about what this will do to your workload profile.

Microbenchmarking

These are mini unit or integration tests designed to ensure that a component operates within a performance benchmark and that deviations are detected.

Microbenchmarking can target things like core application code, SQL queries, and Web Service integrations. There is an enormous amount of potential scope here; for example, you can write a microbenchmark test for a login, or a report execution, or a data transformation--anything goes if it makes sense.

Most importantly, microbenchmarking is a great opportunity to test early in the project lifecycle and provide early feedback.

APM and Code Reviews

In past years, having access to a good APM tool or profiler, or even the source code, has been a luxury. Not anymore--these tools are everywhere, and while a fully featured tool like AppDynamics or New Relic is beneficial for developers and operations, a lot can be achieved with low-cost tools like YourKit Profiler or VisualVM.

APM or profilers allow slow execution paths to be identified, and memory usage and CPU utilisation to be measured. Resource intensive workloads can be easily identified and performance baked into the application.

Container Workloads

Containers will one day rule the world. If you don’t know much about containers, you need to learn about them fast.

In terms of performance engineering, each container handles a small unit of workload and container orchestration engines like Kubernetes will auto-scale that container horizontally across the entire data centre. It’s not uncommon for applications to run on hundreds or thousands of containers.

What’s important here is that the smallest unit of workload is tiny, and scaling is something that a well-designed application will get for free. This allows your performance tests to scale accordingly, and it allows the whole notion of “what is application infrastructure” to be challenged. In the container world, an application is a service definition… and the rest is handled for you.

So, is DevPerfOps a thing? We think so, and we think it will only continue to grow and expand from here. It’s time that performance testing meets the needs of 2018 IT teams, and JDS can help. If you have any questions or want to discuss more, please get in touch with our performance engineering team by emailing [email protected]. If you’re looking for a quick, simple way of getting actionable insights into the performance health of your website or application, check out our current One Second Faster promotion.

Our team on the case

Read more Tech Tips

Monitoring Atlassian Suite with AppDynamics

Millions of IT professionals use JIRA, Confluence, and Bitbucket daily as the backbone of their software lifecycle. These tools are critical to getting anything done in thousands of organisations. If you’re reading this, it’s safe to guess that’s the case for your organisation too!

Application monitoring is crucial when your business relies on good application performance. Just knowing that your application is running isn’t enough; you need assurance that it’s performing optimally. This is what a JDS client that runs in-house instances of JIRA, Confluence, and Bitbucket, recently found out.

This client, a major Australian bank, started to notice slowness with JIRA, but the standard infrastructure monitoring they were using was not providing enough insight to allow them to determine the root cause.

JDS was able to instrument their Atlassian products with AppDynamics APM agents to gain insights into the performance of the applications. After deployment of the Java Agents to the applications, AppDynamics automatically populated the topology map below, known as a Flow Map. This Flow Map shows the interactions for each application, accompanied by overall application and Business Transaction health, and metrics like load, response time, and errors.

After some investigation, we found the root cause of the JIRA slowness was some Memcached backends. Once we determined the root cause and resolved the issue, operational dashboards were created to help the Operations team monitor the Atlassian application suite. Below is a screenshot of a subsection of the dashboard showing Database Response Times, Cache Response Times, and Garbage Collection information.

An overview dashboard was also created to assist with monitoring across the suite. The Dashboard has been split out to show Slow, Very Slow, and Error percentages along with Average Response Times and Call Volumes for each application. Drilldowns were also added to take the user directly to the respective application Flow Map. Using these dashboards, they can, at a glance, check the overall application health for the Atlassian products. This has helped them improve the quality of service and user experience.

The bank’s JIRA users now suffer from far fewer slowdowns, particularly during morning peaks when many hurried story updates are taking place in time for stand-ups! The DevOps team is also able to get a heads-up from AppDynamics when slowness starts to occur, rather than when performance has fallen off a cliff.

So if you’re looking for more effective ways to monitor your Atlassian products, give our AppDynamics team a call. We can develop and implement a customised solution for your business to help ensure your applications run smoothly and at peak performance.

Our team on the case

Our AppDynamics stories

5 quick tips for customising your SAP data in Splunk

Understanding how your SAP system is performing can be a time-consuming process. With multiple environments, servers, APIs, interfaces and applications, there are numerous pieces to the puzzle, and stitching together the end-to-end story requires a lot of work.

That’s where SAP PowerConnect can assist. This SAP-certified tool simplifies the process by seamlessly collating your SAP metrics into a single command console: Splunk. PowerConnect compiles and stores data from each component across your SAP landscape and presents the information in familiar, easily accessible, and customisable Splunk dashboards. When coupled with Splunk’s ability to also gather machine data from non-SAP systems, this solution provides a powerful insight mechanism to understand your end user’s experience.

Given the magnitude of information PowerConnect can collate and analyse, you may think that setting it up would take days—if not weeks—of effort for your technical team. But one of PowerConnect’s key features is its incredibly fast time to value. Whatever the size of your environment, PowerConnect can be rapidly deployed and have searchable data available in less than ten minutes. Furthermore, it is highly customisable in providing the ability to collect data from custom SAP modules and display these in meaningful context sensitive dashboards, or integrate with Splunk IT Service Intelligence.

Here are some quick tips for customising your SAP data with PowerConnect.

1. Use the out-of-the-box dashboards

SAP software runs on top of the SAP NetWeaver platform, which forms the foundation for the majority of applications developed by SAP. The PowerConnect add-on is compatible with NetWeaver versions 7.0 through to 7.5 including S/4 HANA. It runs inside SAP and extracts machine data, security events, and logs from SAP—and ingests the information into Splunk in real time.

PowerConnect can access all data and objects exposed via the SAP NetWeaver layer, including:

  • API
  • Function Modules
  • IDoc
  • Report Writer Reports
  • Change Documents
  • CCMS
  • Tables
PowerConnect has access to all the data and objects exposed via the SAP NetWeaver layer

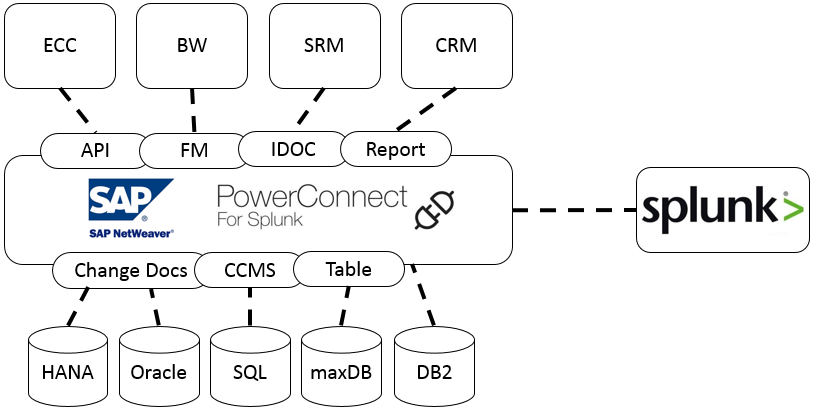
If your SAP system uses S/4 HANA, Fiori, ECC, BW components or all the above, you can gain insight into performance and configuration with PowerConnect.

To help organise and understand the collated data, PowerConnect comes with preconfigured SAP ABAP and Splunk dashboards out of the box based on best practices and customer experiences:

Sample PowerConnect for SAP: SAP ABAP Dashboard

Sample PowerConnect for SAP: Splunk Dashboard

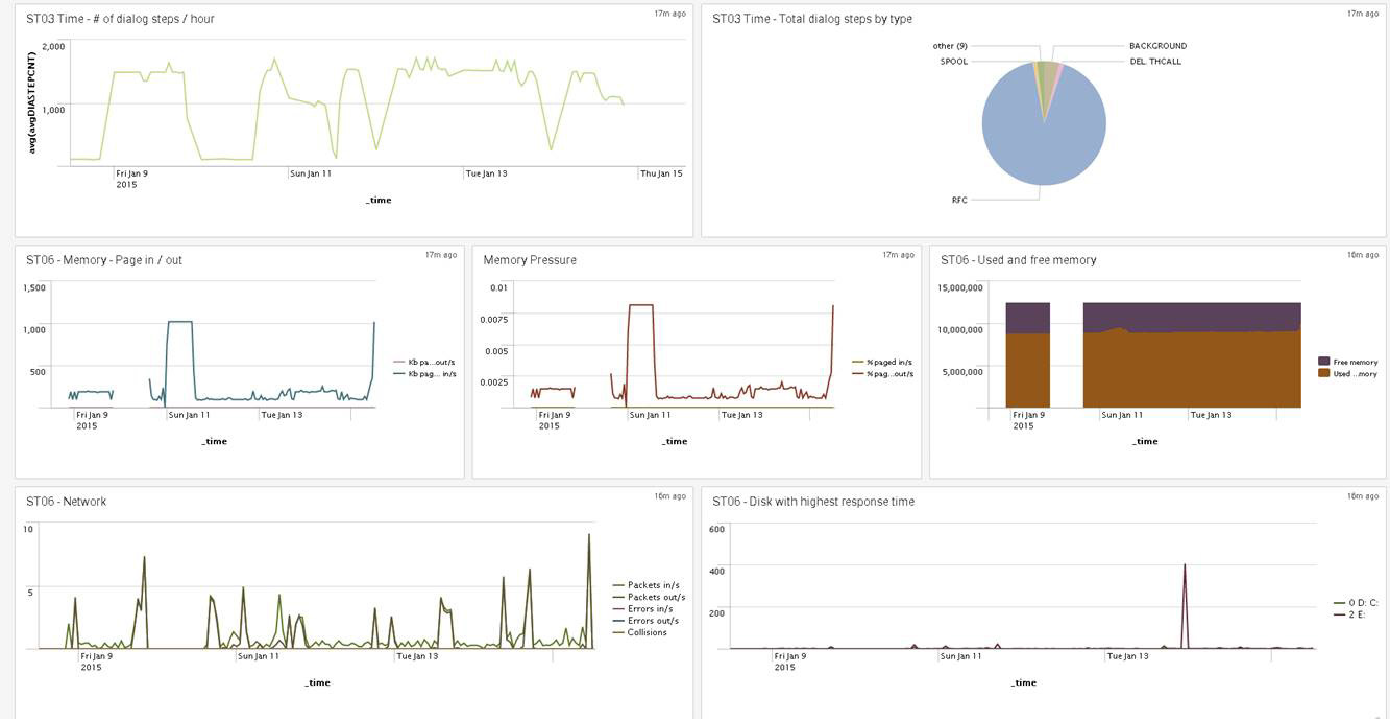
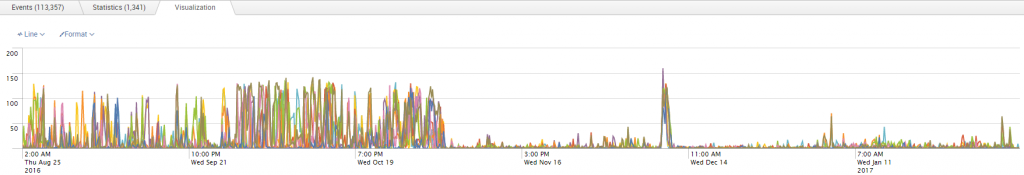
PowerConnect centralises all your operational data in one place, giving you a single view in real time that will help you make decisions, determine strategy, understand the end-user experience, spot trends, and report on SLAs. You can view global trends in your SAP system or drill down to concentrate on metrics from a specific server or user.

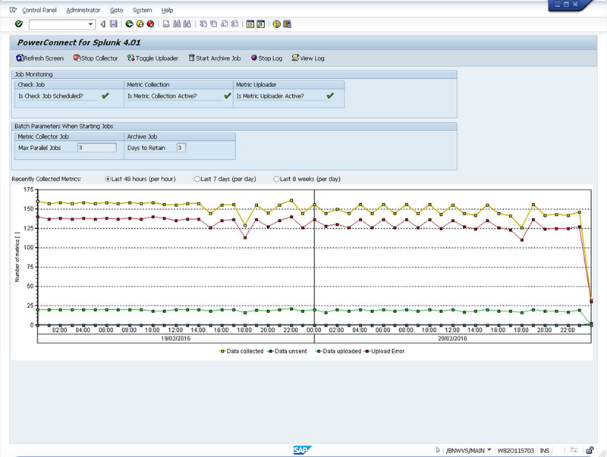
2. Set your data retention specifications

PowerConnect also gives you the ability to configure how, and how long, you store and visualise data. Using Splunk, you can generate reports from across your entire SAP landscape or focus on specific segment(s). You may have long data retention requirements or be more interested in day-to-day performance—either way, PowerConnect can take care of the unique reporting needs for your business when it comes to SAP data.

You have complete control over your data, allowing you to manage data coverage, retention, and access:

  • All data sets that are collected by PowerConnect can be turned off, so you only need to ingest data that interests you.
  • Fine grain control over ingested data is possible by disabling individual fields inside any data sets.
  • You can customise the collection interval for each data set to help manage the flow of data across your network.
  • Data sets can be directed to different indexes, allowing you to manage different data retention and archiving rates for different use cases.

3. Make dashboards for the data that matters to you

You have the full power of Splunk at your disposal to customise the default dashboards, or you can use them as a base to create your own. This means you can use custom visualisations, or pick from those available on Splunkbase to interpret and display the data you’re interested in.

Even better, you’re not limited to SAP data in your searches and on your dashboards; Splunk data from outside your SAP system can be correlated and referenced with your SAP data. For example, you may want to view firewall or load balancer metrics against user volumes, or track sales data with BW usage.

4. Compare your SAP data with other organisational data

It is also possible to ingest PowerConnect data with another Splunk app, such as IT Service Intelligence (ITSI) to create, configure, and measure Service Levels and Key Performance Indicators. SAP system metrics can feed into a centralised view of the health and key performance indicators of your IT services. ITSI can then help proactively identify issues and prioritise resolution of those affecting business-critical services. This out-of-the-box monitoring will give you a comprehensive view of how your SAP system is working.

The PowerConnect framework is extensible and can be adapted to collect metrics from custom developed function modules. Sample custom extractor code templates are provided to allow your developers to quickly extend the framework to capture your custom-developed modules. These are the modules you develop to address specific business needs that SAP doesn’t address natively. As with all custom code, the level of testing will vary, and gaining access to key metrics within these modules can help both analyse usage as well as expose any issues within the code.

5. Learn more at our PowerConnect event

If you are interested in taking advantage of PowerConnect for Splunk to understand how your SAP system is performing, come along to our PowerConnect information night in Sydney or Melbourne in May. Register below to ensure your place.

PowerConnect Explainer Video

How to maintain versatility throughout your SAP lifecycle

There are many use cases for deploying a tool to monitor your SAP system. Releasing your application between test environments, introducing additional users to your production system, or developing new functionality—all of these introduce an element of risk to your application and environment. Whether you are upgrading to SAP HANA, moving data centres, or expanding your use of ECC modules or mobile interfaces (Fiori), you can help mitigate the risk with the insights SAP PowerConnect for Splunk provides.

Upgrading SAP

Before you begin upgrades to your SAP landscape, you need to verify several prerequisites such as hardware and OS requirements, source release of the SAP system, and background process volumes. There are increased memory, session, and process requirements when performing the upgrade, which need to be managed. The SAP PowerConnect solution provides you with all key information about how your system is responding during the transition, with up-to-date process, database, and system usage information.

Triaging and correlating events or incidents is also easier than ever with PowerConnect through its ability to time series historic information. It means you can look back to a specific point in time and see what the health of the system or specific server was, the configuration settings, etc. This is a particularly useful feature for regression testing.

Supporting application and infrastructure migration

Migration poses risks. It’s critical to mitigate those risks through diligent preparation, whether it’s ensuring your current code works on the new platform or that the underlying infrastructure will be fit for purpose.

For example, when planning a migration from an ABAP-based system to an on-premise SAP HANA landscape, there are several migration strategies you can take, depending on how quickly you want to move and what data you want to bring across. With a greenfield deployment, you start from a clean setup and bring across only what you need. The other end of the spectrum is a one-step upgrade with a database migration option (DMO), where you migrate in-place.

Each option will have its own advantages and drawbacks; however, both benefit from the enhanced visibility that PowerConnect provides throughout the deployment and migration process. As code is deployed and patched, PowerConnect will highlight infrastructure resource utilisation issues, greedy processes, and errors from the NetWeaver layer. PowerConnect can also analyse custom ABAP code and investigate events through ABAP code dumps by ID or user.

Increasing user volumes

Deployments can be rolled out in stages, be it through end users or application functionality. This is an effective way to ease users onto the system and lessen the load on both end-user training and support desk tickets due to confusion. As user volume increases, you may find that people don’t behave like you thought they would—meaning your performance test results may not match up with real-world usage. In this case, PowerConnect provides the correlation between the end-user behaviour and the underlying SAP infrastructure performance. This gives you the confidence that if the system starts to experience increased load, you will know about it before it becomes an issue in production. You can also use PowerConnect to learn the new trends in user activity, and feed that information back into the testing cycle to make sure you’re testing as close to real-world scenarios as possible.

It may not be all bad news. PowerConnect can highlight unexpected user behaviour in a positive light, where you might find new users are introduced to the system, they don’t find a feature as popular as you thought they would. Hence you would then be able to turn off the feature to reduce licence usage or opt to promote the feature internally. PowerConnect will not only give you visibility into system resource usage, but also what users are doing on the system to cause that load.

Feedback across the development lifecycle

PowerConnect provides a constant feedback solution with correlation and insights throughout the application delivery lifecycle. Typically migrations, deployments, and upgrades follow a general lifecycle of planning, deploying, then business as usual, before making way for the next patch or version.

During planning and development, you want insights into user activity and the associated infrastructure performance to understand the growth of users over time.

  • With the data retention abilities of Splunk, PowerConnect can identify trends from the last hour right back to the last year and beyond. These usage trends can help define performance testing benchmarks by providing concurrent user volumes, peak periods, and what transactions the users are spending time on.
  • In the absence of response time SLAs, page load time goals can be defined based on current values from the SAP Web Page Response Times dashboard.
  • With the ability to compare parameters, PowerConnect can help you make sure your test and pre-prod environments have the same configuration as production. When the test team doesn’t have access to run RZ10 to view the parameters, a discrepancy can be easy to miss and cause unnecessary delays.

Once in production, PowerConnect also gives you client-centric and client-side insights.

  • You can view the different versions of SAP GUI that users have installed or see a world map showing the global distribution of users.
  • Splunk can even alert from a SecOps perspective, and notify you if someone logs in from a country outside your user base. You can view a list of audited logins and browse the status of user passwords.
  • The power of Splunk gives you the ability to alert or regularly report on trends in the collected data. You can be informed if multiple logins fail, or when the CPU vs Work processes is too high. Automated scripts can be triggered when searches return results so that, for example, a ServiceNow ticket can be raised along with an email alert.

Even after a feature has completed its lifecycle and is ready to be retired, PowerConnect remains rich with historical data describing usage, issues, and configuration settings in Splunk, even if that raw data disappears or has been aggregated from SAP.

Backed by the power of Splunk, and with the wealth of information being collected, the insights provided by PowerConnect will help you effectively manage your SAP system throughout your SAP lifecycle.

What is AIOps?

Gartner has coined another buzz word to describe the next evolution of ITOM solutions. AIOps uses the power of Machine Learning and big data to provide pattern discovery and predictive analysis for IT Ops.

What is the need for AIOps?

Organisations undergoing digital transformation are facing a lot of challenges that they wouldn’t have faced even ten years ago. Digital transformation represents a change in organisation structure, processes, and abilities, all driven by technology. As technology changes, organisations need to change with it.

This change comes with challenges. The old ITOps solutions now need to manage micro services, public and private APIs, and Internet-of-Things devices.

As consumers, IT managers are used to personalised movie recommendations from Netflix, or preemptive traffic warnings from Google. However, their IT management systems typically lack this sort of smarts—reverting to traffic light dashboards.

There is an opportunity in the market to combine big data and machine learning with IT operations.

Gartner has coined this concept AIOps: Artificial Intelligence for IT Ops.

AIOps platforms utilize big data, modern machine learning and other advanced analytics technologies to directly and indirectly enhance IT operations (monitoring, automation and service desk) functions with proactive, personal and dynamic insight. AIOps platforms enable the concurrent use of multiple data sources, data collection methods, analytical (real-time and deep) technologies, and presentation technologies.” – Colin Fletcher, Gartner

AIOps 1

Current State – Gartner Report

Gartner coined the term AIOps in 2016, although they originally called it Algorithmic IT Operations. They don’t yet produce a magic quadrant for AIOps, but that is likely coming.

Gartner has produced a report which summarises both what AIOps is hoping to solve, and which vendors are providing solutions.

Eleven core capabilities are identified, with only four vendors able to do all 11: HPE, IBM, ITRS, and Moogsoft.

How does Splunk do AIOps?

Splunk is well positioned to be a leader in the AIOps field. Their AIOps solution is outlined on their website. Splunk AIOps relies heavily on the Machine Learning Toolkit, which provides Splunk with about 30 different machine learning algorithms.

Splunk provides an enterprise machine learning and big data platform which will help AIOps managers:

  • Get answers and insights for everyone: Through the Splunk Query Language, users can predict past, present, and future patterns of IT systems and service performance.
  • Find and solve problems faster: Detect patterns to identify indicators of incidents and reduce irrelevant alerts.
  • Automate incident response and resolution: Splunk can automate manual tasks, which are triggered based on predictive analytics.
  • Predict future outcomes: Forecast on IT costs and learn from historical analysis. Better predict points of failure to proactively improve the operational environment.
  • Continually learn to take more informed decisions: Detect outliers, adapt thresholds, alert on anomalous patterns, and improve learning over time.

Current offerings like ITSI and Enterprise Security also implement machine learning, which take advantage of anomaly detection and predictive algorithms.

As the complexity in IT systems increases, so too will the need to analyse and interpret the large amount of data generated. Humans have been doing a good job to date, but there will come a point where the complexity will be too great. Organisations which can complement their IT Ops with machine learning will have a strategic advantage over those who rely on people alone.

Conclusion

Top 7 benefits of JDS Active Robot Monitoring

JDS has spent a lot of time this month showing how our bespoke synthetic monitoring solution, Active Robot Monitoring with Splunk, is benefitting a wide variety of businesses. ARM has been used to resolve website issues for a major superannuation company and is improving application performance for a large Australian bank. We’re also currently implementing an ARM solution for one of the biggest universities in Australia and a major medical company. Find out more about the benefits of JDS Active Robot Monitoring below.


Summary of ARM

ARM is a capability developed by JDS that enables synthetic performance monitoring for websites, mobile, cloud-based, on-premise, and SaaS apps. It provides IT staff and managers a global view of what’s happening in your environment, as it’s happening. You can then use the customisable results dashboard to easily consume performance data, and drill down to isolate issues by location or transaction layer.

Top 7 benefits of ARM

1. Get an overall picture of an application’s end-to-end performance

How long does it take for your page to load, or for a user to log in? Can they log in? You may be getting green lights from all of the back-end components individually, but not realise the login process is taking three times longer than normal. ARM gives you the full picture, helping you spot performance issues you may not notice in the back-end.

2. Small increase in data ingested

If you’re already using Splunk, the amount of data you ingest with ARM is minimal, meaning you are getting even more out of your enterprise investment at an extremely low cost.

3. Fast time to value

Many IT projects can take years to show a return on investment, but ARM is not one of them. Once implemented, IT and development teams see value fast as their ability to hone in on and resolve issues accelerates and the number of user issues decreases.

4. Performance and availability metrics based on users location

See how your website, system, or application performs in different locations to find out where issues may be occurring and how to fix them.

5. Proactively find and alert on issues before users do

Users discovering glitches or errors is damaging to a business’s reputation. The ARM robots are constantly on the look-out for problems in the system and will alert you when issues arise so you can resolve them before they negatively impact your customers.

6. Monitor performance 24/7, even while users are asleep

Humans sleep; robots don’t. ARM monitors your application 24/7 to ensure even your late-night customers have a stellar user experience.

7. Get unlimited transactions

Unlike other synthetic monitoring tools, which charge on a per-transaction basis (i.e. every user transaction you want to run invites a new charge), ARM allows you unlimited transactions, so you can measure whatever actions you think your users may take.


How synthetic monitoring will improve application performance for a large bank

JDS is currently working with several businesses across Australia to implement our custom synthetic monitoring solution, Active Robot Monitoring—powered by Splunk. ARM is a simple and effective way of maintaining the highest quality customer experience with minimal cost. While other synthetic monitoring solutions operate on price-per-transaction model, ARM allows you to conduct as many transactions as you want using under the umbrella of your Splunk investment. We recently developed a Splunk ARM solution for one of the largest banks in Australia and are in the process of implementing it. Find out more about the problem presented, our proposed solution, and the expected results below.


The problem

A large Australian bank (‘the Bank’) needs to properly monitor the end-to-end activity of its core systems/applications. This is to ensure that the applications are available and performing as expected at all times. Downtime or poor performance, even for only a few minutes, could potentially result in great loss of revenue and reputation damage. While unscheduled downtime or performance degradation will inevitably occur at some point, the Bank wants to be notified immediately of any performance issues. They also want to identify the root cause of the problem easily, resolve the issue, and restore expected performance and availability as quickly as possible. To achieve this, the Bank approached JDS for a solution to monitor, help triage, and highlight error conditions and abnormal performance.

The solution

JDS proposed implementing the JDS Active Robot Monitoring (ARM) Splunk application. ARM is a JDS-developed Splunk application which utilises scripts written in a variety of languages (e.g. Selenium) with custom built Splunk dashboards. In this case, Selenium is used to emulate actual users interacting with the web application. These interactions or transactions will be used to determine if the application is available, whether a critical function of the application is working properly, and what the performance of the application is like. All that information will be recorded in Splunk and used for analysis.

Availability and performance metrics will be displayed in dashboards, which fulfils several purposes—namely providing management with a summary view of the status of applications and support personnel with more information to help identify the root cause of the problem efficiently. In this case, Selenium was chosen as it provides for complete customisations not available in other similar offerings in the synthetic monitoring segment, and when coupled with Splunk’s analytical and presentation capability, provides the best solution to address the Bank’s problem.

The expected results

With the implementation of the JDS ARM application at the Bank, availability, and performance of their core applications is expected to improve and remain at a higher standard. Downtime, if it occurs, will be quickly rectified as support personnel will be alerted immediately and have access to all the vital data required to do a root cause analysis of the problem quickly. Management will have a better understanding of the health of the application and will be able to assign valuable resources more effectively to work on it.

What can ARM do for your business?

Throughout the month of November 2017, JDS is open to registrations for a free on-site workshop at your business. We will discuss Active Robot Monitoring and how it could benefit your organisation specifically. To register for this exclusive opportunity,  please enter your information below and one of our account executives will contact you to set up a time to meet at your location.

Implementing an electronic signature in ALM


This is where organisations like the FDA (Food and Drug Administration in the United States) and TGA (Therapeutic Goods Administration in Australia) come in, enforcing regulatory controls around all aspects of the manufacturing process to minimise risk and ensure a high level of quality.

These regulatory bodies understand that effective quality assurance goes much further than just regulating the raw materials and manufacturing process. Any software used to control or support the manufacturing process must also adhere to strict quality standards, because a bug in the software can lead to problems in manufacturing with real-world consequences for patients. Software quality assurance can therefore literally be a matter of life or death l.

To ensure that medical manufacturers conduct satisfactory software testing and maintain the required quality assurance standards, the FDA have published the General Principles of Software Validation document which “outlines general validation principles that the Food and Drug Administration (FDA) considers to be applicable to the validation of medical device software or the validation of software used to design, develop, or manufacture medical devices.”

The JDS solution

JDS Australia recently implemented HPE Application Lifecycle Management (ALM) for one of our clients, a manufacturer of medicine delivering more than 10,000 patient doses per week to hospitals in Australia and overseas. ALM is a software testing tool that assists with the end-to-end management of the software testing lifecycle. This includes defining functional and non-functional requirements for a given application and creating test cases to confirm those requirements are met. It also manages all aspects of test execution, the recording and managing of defects, and reporting across the entire testing effort. ALM enables an organisation to implement and enforce their test strategy in a controlled and structured manner, while providing a complete audit trail of all the testing that was performed.

To comply with the FDA requirements, our client required customisation of ALM to facilitate approvals and sign-off of various testing artefacts (test cases, test executions, and defects). The FDA stipulates that approvals must incorporate an electronic signature that validates the user’s identity to ensure the integrity of the process. As an out-of-the-box implementation, ALM does not provide users with the ability to electronically sign artefacts. JDS developed the eSignature add-in to provide this capability and ensure that our client conforms to the regulatory requirements of the FDA.

The JDS eSignature Add-in was developed in C# and consists of a small COM-aware dll file that is installed and registered on the client machine together with the standard ALM client. The eSignature component handles basic field-level checks and credential validation, while all other business rules are managed from the ALM Workflow Customisation. This gives JDS the ability to implement the electronic signature requirements as stipulated by the FDA, while giving us the flexibility to develop customer-specific customisations and implement future enhancements without the need to recompile and reinstall the eSignature component.

Let’s look at a simple test manager approval for a test case to see how it works.

To start with, new “approval” custom fields are added to the Test Plan module which may contain data such as the approval status, a reason/comment and the date and time that the approval was made. These fields are read-only with their values set through the eSignature Workflow customisation. A new “Approve Test” button is added to the toolbar. When the user clicks this button, the Test Approvals form is presented to the user who selects the appropriate approval status, provides a comment, and enters their credentials. When the OK button is clicked, the eSignature component authenticates the user in ALM using an API function from the HPE Open Test Architecture (OTA) COM library.

If the user is successfully authenticated, eSignature passes the relevant information to the ALM workflow script which sets the appropriate field values. The approvals functionality can be further customised to do things such as making the test case read-only or sending an email to the next approver in line to review and approve the test case.

As it currently stands, the eSignature has been implemented in three modules of ALM – Test Plan for test cases that require two levels of review and approval, Test Lab for test execution records that require three levels of review and approval, and Defects to manage the assignment and approvals of defects. This can easily be expanded to include other modules, such as the approvals of test requirements or software releases.

The JDS eSignature add-in has a very small footprint, is easy to install and configure, and provides our clients with the ability to effectively implement an electronic signature capability as part of their software testing strategy.

If you have compliance requirements or are seeking ways to automate your test management processes, contact our support team at JDS Australia. Our consultants are highly skilled across a range of software suites and IT platforms, and we will work with your business to develop custom solutions that work for you.

Contact us at:

T: 1300 780 432

E: [email protected]

The Splunk Gardener

The Splunk wizards at JDS are a talented bunch, dedicated to finding solutions—including in unexpected places. So when Sydney-based consultant Michael Clayfield suffered the tragedy of some dead plants in his garden, he did what our team do best: ensure it works (or ‘lives’, in this case). Using Splunk’s flexible yet powerful capabilities, he implemented monitoring, automation, and custom reporting on his herb garden, to ensure that tragedy didn’t strike twice.

My herb garden consists of three roughly 30cm x 40cm pots, each containing a single plant—rosemary, basil, and chilli. The garden is located outside our upstairs window and receives mostly full sunlight. While that’s good for the plants, it makes it harder to keep them properly watered, particularly during the summer months. After losing my basil and chilli bush over Christmas break, I decided to automate the watering of my three pots, to minimise the chance of losing any more plants. So I went away and designed an auto-watering setup, using soil moisture sensors, relays, pumps, and an Arduino—an open-source electronic platform—to tie it all together.

Testing the setup by transferring water from one bottle to another.

I placed soil moisture sensors in the basil and the chilli pots—given how hardy the rosemary was, I figured I could just hook it up to be watered whenever the basil in the pot next to it was watered. I connected the pumps to the relays, and rigged up some hosing to connect the pumps with their water source (a 10L container) and the pots. When the moisture level of a pot got below a certain level, the Arduino would turn the equivalent pump on and water it for a few seconds. This setup worked well—the plants were still alive—except that I had no visibility over what was going on. All I could see was that the water level in the tank was decreasing. It was essential that the tank always had water in it, otherwise I'd ruin my pumps by pumping air.

To address this problem, I added a float switch to the tank, as I was aiming to set it up so I could stop pumping air if I forgot to fill up the tank. Using a WiFi adapter, I connected the Arduino to my home WiFi. Now that the Arduino was connected to the internet, I figured I should send the data into Splunk. That way I'd be able to set up an alert notifying me when the tank’s water level was low. I'd also be able to track each plant’s moisture levels.

The setup deployed: the water tank is on the left; the yellow cables coming from the tank are for the float switch; and the plastic container houses the pumps and the Arduino, with the red/blue/black wires going to the sensors planted in the soil of the middle (basil) and right (chilli) pots. Power is supplied via the two black cables, which venture back inside the house to a phone charger.

Using the Arduino’s Wifi library, it’s easy to send data to a TCP port. This means that all I needed to do to start collecting data in Splunk was to set up a TCP data input. Pretty quickly I had sensor data from both my chilli and basil plants, along with the tank’s water status. Given how simple it was, I decided to add a few other sensors to the Arduino: temperature, humidity, and light level. With all this information nicely ingested into Splunk, I went about creating a dashboard to display the health of my now over-engineered garden.

The overview dashboard for my garden. The top left and centre show current temperature and humidity, including trend, while the top right shows the current light reading. The bottom left and centre show current moisture reading and the last time each plant was watered. The final panel in the bottom right gives the status of the tank's water level.

With this data coming in, I was able to easily understand what was going on with my plants:

  1. I can easily see the effect watering has on my plants, via the moisture levels (lower numbers = more moisture). I generally aim to maintain the moisture level between 300 and 410. Over 410 and the soil starts getting quite dry, while putting the moisture probe in a glass of water reads 220—so it’s probably best to keep it well above that.
  2. My basil was much thirstier than my chilli bush, requiring about 50–75% more water.
  3. It can get quite hot in the sun on our windowsill. One fortnight in February recorded nine 37+ degree days, with the temperature hitting 47 degrees twice during that period.
  4. During the height of summer, the tank typically holds 7–10 days’ worth of water.

Having this data in Splunk also alerts me to when the system isn't working properly. On one occasion in February, I noticed that my dashboard was consistently displaying that the basil pot had been watered within the last 15 minutes. After a few minutes looking at the data, I was able to figure out what was going on.

Using the above graph from my garden’s Splunk dashboard, I could see that my setup had correctly identified that the basil pot needed to be watered and had watered it—but I wasn't seeing the expected change in the basil’s moisture level. So the next time the system checked the moisture level, it saw that the plant needed to be watered, watered it again, and the cycle continued. When I physically checked the system, I could see that the Arduino was correctly setting the relay and turning the pump on, but no water was flowing. After further investigation, I discovered that the pump had died. Once I had replaced the faulty pump, everything returned to normal.

Since my initial design, I have upgraded the system a few times. It now joins a number of other Arduinos I have around the house, sending data via cheap radio transmitters to a central Arduino that then forwards the data on to Splunk. Aside from the pump dying, the garden system has been functioning well for the past six months, providing me with data that I will use to continue making the system a bit smarter about how and when it waters my plants.

I've also 3D printed a nice case in UV-resistant plastic, so my gardening system no longer has to live in an old lunchbox.

Our team on the case

Using Splunk and Active Robot Monitoring to resolve website issues

Recently, one of JDS’ clients reached out for assistance, as they were experiencing inconsistent website performance. They had just moved to a new platform, and were receiving alerts about unexpectedly slow response times, as well as intermittent logon errors. They were concerned that, were the reports accurate, this would have an adverse impact on customer retention, and potentially reduce their ability to attract new customers. When manual verification couldn’t reproduce the issues, they called in one of JDS’ sleuths to try to locate and fix the problem—if one existed at all.

The Plot Thickens

The client’s existing active robot monitoring solution using the HPE Business Process Monitor (BPM) suite showed that there were sporadic difficulties in loading pages on the new platform and in logging in, but the client was unable to replicate the issue manually. If there was an issue, where exactly did it lie?

Commencing the Investigation

The client had deployed Splunk and it was ingesting logs from the application in question—but its features were not being utilised to investigate the issue.

JDS consultant Danesen Narayanen entered the fray and was able to use Splunk to analyse the data received. He could therefore immediately understand the issue the client was experiencing. He confirmed that the existing monitoring solution was reporting the problem accurately, and that the issue had not been affecting the client’s website prior to the re-platform

Using the data collected by HPE BPM as a starting point, Danesen was able to drill down and compare what was happening with the current system on the new platform to what had been happening on the old one. He quickly made several discoveries:

1. There appeared to be some kind of server error.

Since the re-platform, there had been a spike in a particular server error. Our JDS consultant reviewed data from the previous year, to see whether the error had happened before. He noted that there had previously been similar issues, and validated them against BPM to determine that the past errors had not had a pronounced effect on BPM—the spike in server errors seemed to be a symptom, rather than a cause.

Database deadlocks were spiking.
Database deadlocks were spiking
It was apparent that the error had happened before

2. There seemed to be an issue with user-end response time.

Next, our consultant used Splunk to look at the response time by IP addresses over time, to see if there was a particular location being affected—was the problem at server end, or user end? He identified one particular IP address which had a very high response time. What’s more, this was a public IP address, rather than one internal to the client. It seemed like there was a end-user problem—but what was the IP address that was causing BPM to report an issue?

Daily response time for all IPs (left axis), and for the abnormal IP (right axis). All times are in seconds.

Tracking Down the Mystery IP Address

At this point our consultant called for the assistance of another JDS staff member, to track down who owned the problematic IP address. As it turned out, the IP address was owned by the client, and was being used by a security tool running vulnerability checks on the website. After the re-platform, the tool had gone rogue: rather than running for half an hour after the re-platform, it continued to open a number of new web sessions throughout the day for several days.

The Resolution

Now that the culprit had been identified, the team were quickly able to log in to the security tool to turn it off, and the problem disappeared. Performance and availability times returned to what they should be, BPM was no longer reporting issues, and the client’s website was running smoothly once more. Thanks to the combination of Splunk’s power, HPE's active monitoring tools, and JDS’ analytical and diagnostic experience, resolution was achieved in under a day.

JDS Australia is now an AC3 company.