Category: Blog

Using Common Functions in the Service Catalog

ServiceNow’s service portal offers a lot of flexibility for customers wanting to offer complex and sophisticated offerings to their users. Catalog client scripts can run on load, on change and on submit, but often there’s a need for a common library of functions to be shared by these scripts (so they’re maintained in just one place and produce consistent results).

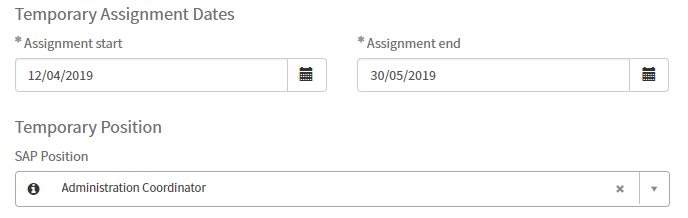
For example, in this case, if the start date, end date or the SAP position changes, the same script needs to run to calculate who the approvers are for a particular request.

Rather than having three separate versions of the same script, we want to be able to store our logic in one place. Here’s how we can do it.


Isolate Script

Although the latest versions of ServiceNow (London, Madrid, etc) allow for scripts to be isolated or not, giving ServiceNow admins either the option of protecting (isolating) their scripts or accessing broader libraries, in practice, this can be a little frustrating to implement, so in our example, we’ll use an alternative method to introduce external javascript libraries.


UI Scripts

UI scripts, like the one listed below, are very powerful, but they’re also very broad, being applied EVERYWHERE and ALWAYS, so we’ll tread lightly and simply add a function that sets up the DOM for access from our client scripts.

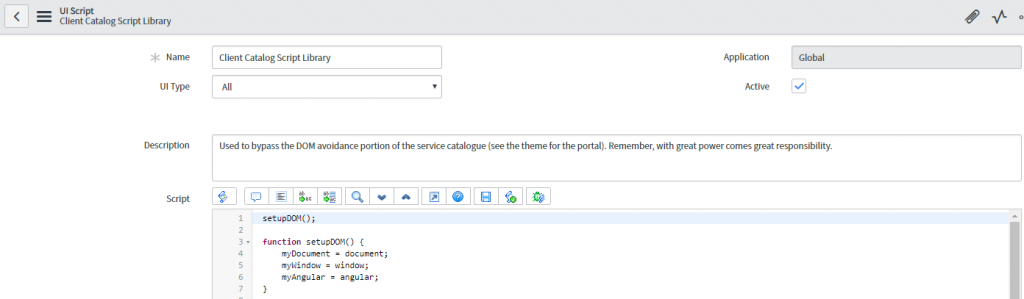
As you can see, we now have some variables we can reference to give us access to the document object, the window object and the angular object from anywhere within ServiceNow.

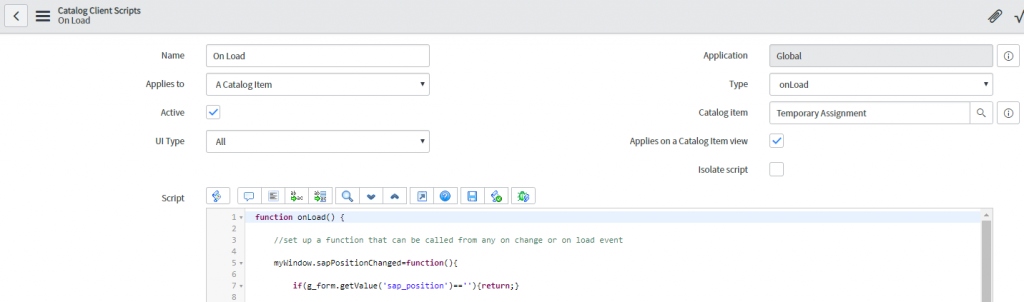
In theory, we could attach our SAP position changes script here and it would be accessible but it would also be loaded on EVERY page ServiceNow ever loads, which is not good. What we want is a global function accessible only from WITHIN our catalog item, so we’ll put this in an ON LOAD script using our new myWindow object.

The format we’re using is…

myWindow.functionName = function(){

console.log('this is an example')

};

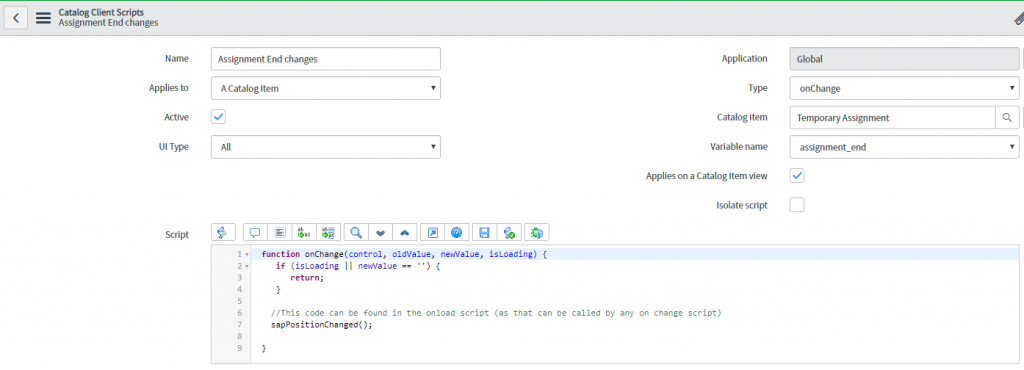
This function can then be called from ANYWHERE within our catalog item (on change or on submit). Also, notice the semi-colon at the end of the window function. Don’t forget this as it is important as we’re altering an object.

Now, though, any time we want to call that common function, we can do so with a single line of code.


Following this approach makes maintenance of the logic used by the approval process easy to find and alter going forward.

Conclusion

To learn more about how JDS can optimize the performance of ServiceNow, contact our team today on 1300 780 432, or email [email protected].

Finding Exoplanets with Splunk

Splunk is a software platform designed to search, analyze and visualize machine-generated data, making sense of what, to most of us, looks like chaos.

Ordinarily, the machine data used by Splunk is gathered from websites, applications, servers, network equipment, sensors, IoT (internet-of-things) devices, etc, but there’s no limit to the complexity of data Splunk can consume.

Splunk specializes in Big Data, so why not use it to search the biggest data of all and find exoplanets?

What is an exoplanet?

An exoplanet is a planet in orbit around another star.

The first confirmed exoplanet was discovered in 1995 orbiting the star 51 Pegasi, which makes this an exciting new, emerging field of astronomy. Since then, Earth-based and space-based telescopes such as Kepler have been used to detect thousands of planets around other stars.

At first, the only planets we found were super-hot Jupiters, enormous gas giants orbiting close to their host stars. As techniques have been refined, thousands of exoplanets have been discovered at all sizes and out to distances comparable with planets in our own solar system. We have even discovered exomoons!


How do you find an exoplanet?

Imagine standing on stage at a rock concert, peering toward the back of the auditorium, staring straight at one of the spotlights. Now, try to figure out when a mosquito flies past that blinding light. In essence, that’s what telescopes like NASA’s TESS (Transiting Exoplanet Survey Satellite) are doing.

The dip in starlight intensity can be just a fraction of a percent, but it’s enough to signal that a planet is transiting the star.

Transits have been observed for hundreds of years in one form or another, but only recently has this idea been applied outside our solar system.

Australia has a long history of human exploration, starting some 60,000 years ago. In 1769 after (the then) Lieutenant James Cook sailed to Tahiti to observe the transit of Venus across the face of the our closest star, the Sun, he was ordered to begin a new search for the Great Southern Land which we know as Australia. Cook’s observation of the transit of Venus used largely the same technique as NASA’s Hubble, Kepler and TESS space telescopes but on a much simpler scale.

Our ability to monitor planetary transits has improved considerably since the 1700s.

NASA’s TESS orbiting telescope can cover an area 400 times as broad as NASA’s Kepler space telescope and is capable of monitoring a wider range of star types than Kepler, so we are on the verge of finding tens of thousands of exoplanets, some of which may contain life!

How can we use Splunk to find an exoplanet?

 Science thrives on open data.

All the raw information captured by both Earth-based and space-based telescopes like TESS are publicly available, but there’s a mountain of data to sift through and it’s difficult to spot needles in this celestial haystack, making this an ideal problem for Splunk to solve.

While playing with this over Christmas, I used the NASA Exoplanet Archive, and specifically the PhotoMetric data containing 642 light curves to look for exoplanets. I used wget in Linux to retrieve the raw data as text files, but it is possible to retrieve this data via web services.

MAST, the Mikulski Archive for Space Telescopes, has made available a web API that allows up to 500,000 records to be retrieved at a time using JSON format, making the data even more accessible to Splunk.

Some examples of API queries that can be run against the MAST are:

The raw data for a given observation appears as:

Information from the various telescopes does differ in format and structure, but it’s all stored in text files that can be interrogated by Splunk.

Values like the name of the star (in this case, Gliese 436) are identified in the header, while dates are stored either using HJD (Heliocentric Julian Dates) or BJD (Barycentric Julian Dates) centering on the Sun (with a difference of only 4 seconds between them).

Some observatories will use MJD which is the Modified Julian Date (being the Julian Date minus 2,400,000.5 which equates to November 17, 1858). Sounds complicated, but MJD is an attempt to simplify date calculations.

Think of HJD, BJD and MJD like UTC but for the entire solar system.

One of the challenges faced in gathering this data is that the column metadata is split over three lines, with the title, the data type and the measurement unit all appearing on separate lines.

The actual data captured by the telescope doesn’t start being displayed until line 138 (and this changes from file to file as various telescopes and observation sets have different amounts of associated metadata).

In this example, our columns are…

  • HJD - which is expressed as days, with the values beyond the decimal point being the fraction of that day when the observation occurred
  • Normalized Flux - which is the apparent brightness of the star
  • Normalized Flux Uncertainty - capturing any potential anomalies detected during the collection process that might cast doubt on the result (so long as this is insignificant it can be ignored).

Heliocentric Julian Dates (HJD) are measured from noon (instead of midnight) on 1 January 4713 BC and are represented by numbers into the millions, like 2,455,059.6261813 where the integer is the days elapsed since then, while the decimal fraction is the portion of the day. With a ratio of 0.00001 to 0.864 seconds, multiplying the fraction by 86400 will give us the seconds elapsed since noon on any given Julian Day. Confused? Well, your computer won’t be as it loves working in decimals and fractions, so although this system may seem counterintuitive, it makes date calculations simple math.

We can reverse engineer Epoch dates and regular dates from HJD/BJD, giving Splunk something to work with other than obscure heliocentric dates.

  • As Julian Dates start at noon rather than midnight, all our calculations are shifted by half a day to align with Epoch (Unix time)
  • The Julian date for the start of Epoch on CE 1970 January 1st 00:00:00.0 UT is 2440587.500000
  • Any-Julian-Date-minus-Epoch = 2455059.6261813 - 2440587.5 = 14472.12618
  • Epoch-Day = floor(Any-Julian-Date-minus-Epoch) * milliseconds-in-a-day = 14472 * 86400000 = 1250380800000
  • Epoch-Time = floor((Any-Julian-Date-minus-Epoch – floor(Any-Julian-Date-minus-Epoch)) * milliseconds-in-a-day = floor(0. 6261813 * 86400000) = 10902064
  • Observation-Epoch-Day-Time = Epoch-Day + Epoch-Time = 1250380800000 + 10902064 = 1250391702064

That might seem a little convoluted, but we now have a way of translating astronomical date/times into something Splunk can understand.

I added a bunch of date calculations like this to my props.conf file so dates would appear more naturally within Splunk.

[exoplanets]

SHOULD_LINEMERGE = false

LINE_BREAKER = ([\r\n]+)

EVAL-exo_observation_epoch = ((FLOOR(exo_HJD - 2440587.5) * 86400000) + FLOOR(((exo_HJD - 2440587.5) - FLOOR(exo_HJD - 2440587.5))  *  86400000))

EVAL-exo_observation_date = (strftime(((FLOOR(exo_HJD - 2440587.5) * 86400000) + FLOOR(((exo_HJD - 2440587.5) - FLOOR(exo_HJD - 2440587.5))  *  86400000)) / 1000,"%d/%m/%Y %H:%M:%S.%3N"))

EVAL-_time = strptime((strftime(((FLOOR(exo_HJD - 2440587.5) * 86400000) + FLOOR(((exo_HJD - 2440587.5) - FLOOR(exo_HJD - 2440587.5))  *  86400000)) / 1000,"%d/%m/%Y %H:%M:%S.%3N")),"%d/%m/%Y %H:%M:%S.%3N")

Once date conversions are in place, we can start crafting queries that map the relative flux of a star and allow us to observe exoplanets in another solar system.

Let’s look at a star with the unassuming ID 0300059.

sourcetype=exoplanets host="0300059"

| rex field=_raw "\s+(?P<exo_HJD>24\d+.\d+)\s+(?P<exo_flux>[-]?\d+.\d+)\s+(?P<exo_flux_uncertainty>[-]?\d+.\d+)" | timechart span=1s avg(exo_flux)

And there it is… an exoplanet blotting out a small fraction of starlight as it passes between us and its host star!

What about us?

While curating the Twitter account @RealScientists, Dr. Jessie Christiansen made the point that we only see planets transit stars like this if they’re orbiting on the same plane we’re observing. She also pointed out that “if you were an alien civilization looking at our solar system, and you were lined up just right, every 365 days you would see a (very tiny! 0.01%!!) dip in the brightness that would last for 10 hours or so. That would be Earth!”

There have even been direct observations of planets in orbit around stars, looking down from above (or up from beneath depending on your vantage point). With the next generation of space telescopes, like the James Webb, we’ll be able to see these in greater detail.


Image credit: NASA exoplanet exploration

Next steps

From here, the sky’s the limit—quite literally.

Now we’ve brought data into Splunk we can begin to examine trends over time.

Astronomy is BIG DATA in all caps. The Square Kilometer Array (SKA), which comes on line in 2020, will create more data each day than is produced on the Internet in a year!

Astronomical data is the biggest of the Big Data sets and that poses a problem for scientists. There’s so much data it is impossible to mine it all thoroughly. This has led to the emergence of citizen science, where regular people can contribute to scientific discoveries using tools like Splunk.

Most stars have multiple planets, so some complex math is required to distinguish between them, looking at the frequency, magnitude and duration of their transits to identify them individually. Over the course of billions of years, the motion of planets around a star fall into a pattern known as orbital resonance, which is something that can be predicted and tested by Splunk to distinguish between planets and even be used to predict undetected planets!

Then there’s the tantalizing possibility of exomoons orbiting exoplanets. These moons would appear as a slight dip in the transit line (similar to what’s seen above at the end of the exoplanet’s transit). But confirming the existence of an exomoon relies on repeated observations, clearly distinguished from the motion of other planets around that star. Once isolated, the transit lines should show a dip in different locations for different transits (revealing how the exomoon is swinging out to the side of the planet and increasing the amount of light being blocked at that point).

Given its strength with modelling data, predictive analytics and machine learning, Splunk is an ideal platform to support the search for exoplanets.

Find out more

If you’d like to learn more about how Splunk can help your organization reach for the stars, contact one of our account managers.

Our team on the case

Our Splunk stories

Governance, Risk & Compliance

ServiceNow has implemented Governance, Risk and Compliance (GRC) based on the OCEG (Open Compliance & Ethics Group) GRP Capability Model.

What is GRC?

  • Governance allows an organisation to reliably achieve its objectives
  • Risk addresses uncertainty in a structured manner
  • Compliance ensures business activities are undertaken with integrity

Whether organisations formally recognize GRC or not, they all need to undertake some form of governance over their business activities or they will not be able to reliably achieve their goals.

When it comes to risk, recognising and addressing uncertainty ensures the durability of an organisation before it is placed in a position where it is under stress. Public and government expectations are that organisations will act with integrity; failure to do so may result in a loss of revenue, loss of social standing and possibly government fines or loss of licensing.

Governance, Risk and Compliance is built around the authority documents, policies and risks identified by the organisation as important.

Depending on the industry, there are a number of standards authorities and government regulations that form the basis for documents of authority, providing specific compliance regulations. ISO (the International Organisation for Standardization) has established quality assurance standards such as ISO 9000, and risk management frameworks such as ISO 31000, or ISO 27000 standards for information security management.

In addition to these, various governments may demand adherence to standards developed to protect the public, such as Sarbanes-Oxley (to protect investors against possible fraud), HIPAA (the US Health Insurance Portability and Accountability Act of 1996) and GDPR (the European Union’s General Data Protection Regulation). ServiceNow’s GRC allows organisations to manage these complex requirements and ensure they are compliant and operating efficiently.

The sheer number of documents and standards, along with the complexity of how they depend on and interact with each other, can make GRC daunting to administer. ServiceNow has simplified this process by structuring these activities in a logical framework.

Authority documents (like ISO 27000), internal policies and risk frameworks (like ISO 31000) represent a corporate library—the ideal state for the organisation. The question then becomes, how well does an organisation measure up to its ideals in terms of policies and risks?

ServiceNow addresses this by using profile types.

Profile types are a means of translating polices and risks into practice.

When policy types are applied to policy statements, they form the active controls for an organisation— that is, those controls from the library that are being actively monitored.

In the same way, when risks are applied to policy types, they form the risk register for the organization. This is the definitive list of those specific risks that are being actively measured and monitored, as opposed to all risks.

This approach allows organisations to accurately measure their governance model and understand which areas they need to focus on to improve.

The metrics supporting GRC profile types can be gathered manually via audit-styled surveys of employees and third-parties, or in an automated fashion using information stored elsewhere within ServiceNow (such as IT Service Management or Human Resources). In addition to this, GRC compliance metrics for the various profile types can be gathered using orchestration and automation, and by integrating with other systems to provide an accurate view of governance, risk and compliance.

If you would like to learn more about how ServiceNow can support your organisation manage the complexity of GRC, please speak to one of our account executives.

Conclusion

It doesn’t need to be complicated! Reach out to us and we can help you manage your organizational risks.

Asset Management in ServiceNow

Effective ICT departments are increasingly reliant on solid software and hardware asset management, yet the concept can often strike fear into the hearts of organisations as the complexity and work involved can seem endless. Indeed, Asset Management can be like trying to reach the moon with a step ladder! New advances in ServiceNow seek to change that ladder into a rocket - here’s how.


Business Goals (Launch Pad): Truly understanding your business goals and processes is an important and often underrated start to successful asset management. Clarifying business requirements allows us here at JDS to recommend suitable approaches to customers and help realise benefits faster. A recurring challenge we address is reducing unnecessary costs in over-licensed software. Through the power of ServiceNow technology, we can help you automate the removal and management of licenses.

Accurate Data (Rocket Fuel): Accurate data is the fuel behind asset management. With asset data commonly scattered across multiple systems, trusted data sources are paramount; often with organisations reliant on these to track and extract information for reports and often crucial decisions. JDS is experienced in tools such as ServiceNow Discovery and integrations with third-party providers like MicroFocus uCMDB, Microsoft SCCM and Ivanti LANDESK – proven solutions to assist management teams with data for business strategy.Using ServiceNow, we can help plan data imports/transformations to ensure information is accurate. This means asset info can be normalised automatically to improve data quality and ensure accurate reporting.


Asset Management on ServiceNow (Rocket Engine): With clear business goals and a focus on accurate data, ServiceNow also has further capabilities to propel your asset management process. Customers can now manage the lifecycle of asset management with refined expertise. JDS are champions of this automation process, particularly as proven benefits include streamlining and having an entire lifecycle consolidated and managed from one location, to greatly improve visibility and overall management.


Ongoing Management (Control Panel): With robust asset management now implemented, customers need a suitable control panel to help maintain momentum and drive continuous process improvement. Utilising a mix of existing ServiceNow and customised reports and dashboards, organisations are now able to easily digest data like never before.

Example of Software Asset Management

Example of Hardware Asset Management

Our team here are experienced in assisting customers setup ongoing asset reviews and audits on these platforms. One example of how we’ve customised this process, is by automating regular asset stocktake tasks, which can then be monitored and reported on the ServiceNow platform.

Conclusion

Successful Asset Management can be a journey, yet well worth the effort by significantly improving on processes and reducing operational costs. Our team are experts in devising solutions with customers, to realise and maximise the value of efficient asset management; and help firmly plant your organisation’s foot and flag on the moon!

Conclusion

Need help in planning and implementing a robust asset management solution? Reach out to us with your current challenges, we would love to help.

What is AIOps?

Gartner has coined another buzz word to describe the next evolution of ITOM solutions. AIOps uses the power of Machine Learning and big data to provide pattern discovery and predictive analysis for IT Ops.

What is the need for AIOps?

Organisations undergoing digital transformation are facing a lot of challenges that they wouldn’t have faced even ten years ago. Digital transformation represents a change in organisation structure, processes, and abilities, all driven by technology. As technology changes, organisations need to change with it.

This change comes with challenges. The old ITOps solutions now need to manage micro services, public and private APIs, and Internet-of-Things devices.

As consumers, IT managers are used to personalised movie recommendations from Netflix, or preemptive traffic warnings from Google. However, their IT management systems typically lack this sort of smarts—reverting to traffic light dashboards.

There is an opportunity in the market to combine big data and machine learning with IT operations.

Gartner has coined this concept AIOps: Artificial Intelligence for IT Ops.

AIOps platforms utilize big data, modern machine learning and other advanced analytics technologies to directly and indirectly enhance IT operations (monitoring, automation and service desk) functions with proactive, personal and dynamic insight. AIOps platforms enable the concurrent use of multiple data sources, data collection methods, analytical (real-time and deep) technologies, and presentation technologies.” – Colin Fletcher, Gartner

AIOps 1

Current State – Gartner Report

Gartner coined the term AIOps in 2016, although they originally called it Algorithmic IT Operations. They don’t yet produce a magic quadrant for AIOps, but that is likely coming.

Gartner has produced a report which summarises both what AIOps is hoping to solve, and which vendors are providing solutions.

Eleven core capabilities are identified, with only four vendors able to do all 11: HPE, IBM, ITRS, and Moogsoft.

How does Splunk do AIOps?

Splunk is well positioned to be a leader in the AIOps field. Their AIOps solution is outlined on their website. Splunk AIOps relies heavily on the Machine Learning Toolkit, which provides Splunk with about 30 different machine learning algorithms.

Splunk provides an enterprise machine learning and big data platform which will help AIOps managers:

  • Get answers and insights for everyone: Through the Splunk Query Language, users can predict past, present, and future patterns of IT systems and service performance.
  • Find and solve problems faster: Detect patterns to identify indicators of incidents and reduce irrelevant alerts.
  • Automate incident response and resolution: Splunk can automate manual tasks, which are triggered based on predictive analytics.
  • Predict future outcomes: Forecast on IT costs and learn from historical analysis. Better predict points of failure to proactively improve the operational environment.
  • Continually learn to take more informed decisions: Detect outliers, adapt thresholds, alert on anomalous patterns, and improve learning over time.

Current offerings like ITSI and Enterprise Security also implement machine learning, which take advantage of anomaly detection and predictive algorithms.

As the complexity in IT systems increases, so too will the need to analyse and interpret the large amount of data generated. Humans have been doing a good job to date, but there will come a point where the complexity will be too great. Organisations which can complement their IT Ops with machine learning will have a strategic advantage over those who rely on people alone.

Conclusion

Top 7 benefits of JDS Active Robot Monitoring

JDS has spent a lot of time this month showing how our bespoke synthetic monitoring solution, Active Robot Monitoring with Splunk, is benefitting a wide variety of businesses. ARM has been used to resolve website issues for a major superannuation company and is improving application performance for a large Australian bank. We’re also currently implementing an ARM solution for one of the biggest universities in Australia and a major medical company. Find out more about the benefits of JDS Active Robot Monitoring below.


Summary of ARM

ARM is a capability developed by JDS that enables synthetic performance monitoring for websites, mobile, cloud-based, on-premise, and SaaS apps. It provides IT staff and managers a global view of what’s happening in your environment, as it’s happening. You can then use the customisable results dashboard to easily consume performance data, and drill down to isolate issues by location or transaction layer.

Top 7 benefits of ARM

1. Get an overall picture of an application’s end-to-end performance

How long does it take for your page to load, or for a user to log in? Can they log in? You may be getting green lights from all of the back-end components individually, but not realise the login process is taking three times longer than normal. ARM gives you the full picture, helping you spot performance issues you may not notice in the back-end.

2. Small increase in data ingested

If you’re already using Splunk, the amount of data you ingest with ARM is minimal, meaning you are getting even more out of your enterprise investment at an extremely low cost.

3. Fast time to value

Many IT projects can take years to show a return on investment, but ARM is not one of them. Once implemented, IT and development teams see value fast as their ability to hone in on and resolve issues accelerates and the number of user issues decreases.

4. Performance and availability metrics based on users location

See how your website, system, or application performs in different locations to find out where issues may be occurring and how to fix them.

5. Proactively find and alert on issues before users do

Users discovering glitches or errors is damaging to a business’s reputation. The ARM robots are constantly on the look-out for problems in the system and will alert you when issues arise so you can resolve them before they negatively impact your customers.

6. Monitor performance 24/7, even while users are asleep

Humans sleep; robots don’t. ARM monitors your application 24/7 to ensure even your late-night customers have a stellar user experience.

7. Get unlimited transactions

Unlike other synthetic monitoring tools, which charge on a per-transaction basis (i.e. every user transaction you want to run invites a new charge), ARM allows you unlimited transactions, so you can measure whatever actions you think your users may take.


The Splunk Gardener

The Splunk wizards at JDS are a talented bunch, dedicated to finding solutions—including in unexpected places. So when Sydney-based consultant Michael Clayfield suffered the tragedy of some dead plants in his garden, he did what our team do best: ensure it works (or ‘lives’, in this case). Using Splunk’s flexible yet powerful capabilities, he implemented monitoring, automation, and custom reporting on his herb garden, to ensure that tragedy didn’t strike twice.

My herb garden consists of three roughly 30cm x 40cm pots, each containing a single plant—rosemary, basil, and chilli. The garden is located outside our upstairs window and receives mostly full sunlight. While that’s good for the plants, it makes it harder to keep them properly watered, particularly during the summer months. After losing my basil and chilli bush over Christmas break, I decided to automate the watering of my three pots, to minimise the chance of losing any more plants. So I went away and designed an auto-watering setup, using soil moisture sensors, relays, pumps, and an Arduino—an open-source electronic platform—to tie it all together.

Testing the setup by transferring water from one bottle to another.

I placed soil moisture sensors in the basil and the chilli pots—given how hardy the rosemary was, I figured I could just hook it up to be watered whenever the basil in the pot next to it was watered. I connected the pumps to the relays, and rigged up some hosing to connect the pumps with their water source (a 10L container) and the pots. When the moisture level of a pot got below a certain level, the Arduino would turn the equivalent pump on and water it for a few seconds. This setup worked well—the plants were still alive—except that I had no visibility over what was going on. All I could see was that the water level in the tank was decreasing. It was essential that the tank always had water in it, otherwise I'd ruin my pumps by pumping air.

To address this problem, I added a float switch to the tank, as I was aiming to set it up so I could stop pumping air if I forgot to fill up the tank. Using a WiFi adapter, I connected the Arduino to my home WiFi. Now that the Arduino was connected to the internet, I figured I should send the data into Splunk. That way I'd be able to set up an alert notifying me when the tank’s water level was low. I'd also be able to track each plant’s moisture levels.

The setup deployed: the water tank is on the left; the yellow cables coming from the tank are for the float switch; and the plastic container houses the pumps and the Arduino, with the red/blue/black wires going to the sensors planted in the soil of the middle (basil) and right (chilli) pots. Power is supplied via the two black cables, which venture back inside the house to a phone charger.

Using the Arduino’s Wifi library, it’s easy to send data to a TCP port. This means that all I needed to do to start collecting data in Splunk was to set up a TCP data input. Pretty quickly I had sensor data from both my chilli and basil plants, along with the tank’s water status. Given how simple it was, I decided to add a few other sensors to the Arduino: temperature, humidity, and light level. With all this information nicely ingested into Splunk, I went about creating a dashboard to display the health of my now over-engineered garden.

The overview dashboard for my garden. The top left and centre show current temperature and humidity, including trend, while the top right shows the current light reading. The bottom left and centre show current moisture reading and the last time each plant was watered. The final panel in the bottom right gives the status of the tank's water level.

With this data coming in, I was able to easily understand what was going on with my plants:

  1. I can easily see the effect watering has on my plants, via the moisture levels (lower numbers = more moisture). I generally aim to maintain the moisture level between 300 and 410. Over 410 and the soil starts getting quite dry, while putting the moisture probe in a glass of water reads 220—so it’s probably best to keep it well above that.
  2. My basil was much thirstier than my chilli bush, requiring about 50–75% more water.
  3. It can get quite hot in the sun on our windowsill. One fortnight in February recorded nine 37+ degree days, with the temperature hitting 47 degrees twice during that period.
  4. During the height of summer, the tank typically holds 7–10 days’ worth of water.

Having this data in Splunk also alerts me to when the system isn't working properly. On one occasion in February, I noticed that my dashboard was consistently displaying that the basil pot had been watered within the last 15 minutes. After a few minutes looking at the data, I was able to figure out what was going on.

Using the above graph from my garden’s Splunk dashboard, I could see that my setup had correctly identified that the basil pot needed to be watered and had watered it—but I wasn't seeing the expected change in the basil’s moisture level. So the next time the system checked the moisture level, it saw that the plant needed to be watered, watered it again, and the cycle continued. When I physically checked the system, I could see that the Arduino was correctly setting the relay and turning the pump on, but no water was flowing. After further investigation, I discovered that the pump had died. Once I had replaced the faulty pump, everything returned to normal.

Since my initial design, I have upgraded the system a few times. It now joins a number of other Arduinos I have around the house, sending data via cheap radio transmitters to a central Arduino that then forwards the data on to Splunk. Aside from the pump dying, the garden system has been functioning well for the past six months, providing me with data that I will use to continue making the system a bit smarter about how and when it waters my plants.

I've also 3D printed a nice case in UV-resistant plastic, so my gardening system no longer has to live in an old lunchbox.

Our team on the case